Kraft 2002 Annual Report Download - page 60
Download and view the complete annual report
Please find page 60 of the 2002 Kraft annual report below. You can navigate through the pages in the report by either clicking on the pages listed below, or by using the keyword search tool below to find specific information within the annual report.-
 1
1 -
2
-
3
-
4
-
5
-
6
-
7
-
8
-
9
-
10
-
11
-
12
-
13
-
14
-
15
-
16
-
17
-
18
-
19
-
20
-
21
-
22
-
23
-
24
-
25
-
26
-
27
-
28
-
29
-
30
-
31
-
32
-
33
-
34
-
35
-
36
-
37
-
38
-
39
-
40
-
41
-
42
-
43
-
44
-
45
-
46
-
47
-
48
-
49
-
 50
50 -
 51
51 -
 52
52 -
 53
53 -
 54
54 -
 55
55 -
 56
56 -
 57
57 -
 58
58 -
 59
59 -
 60
60 -
 61
61 -
 62
62 -
 63
63 -
 64
64 -
 65
65 -
 66
66 -
 67
67 -
 68
68 -
 69
69 -
 70
70
 |
 |

56
kraft foods inc. notes to consolidated financial statements
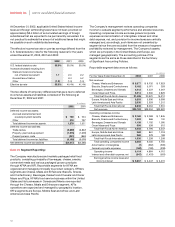
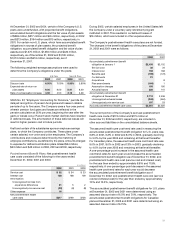
At December 31, 2002, applicable United States federal income
taxes and foreign withholding taxes have not been provided on
approximately $2.4 billion of accumulated earnings of foreign
subsidiaries that are expected to be permanently reinvested. It is
not practical to estimate the amount of additional taxes that might
be payable on such undistributed earnings.
The effective income tax rate on pre-tax earnings differed from the
U.S. federal statutory rate for the following reasons for the years
ended December 31, 2002, 2001 and 2000:
2002 2001 2000
U.S. federal statutory rate 35.0% 35.0% 35.0%
Increase (decrease) resulting from:
State and local income taxes,
net of federal tax benefit 1.7 2.0 2.2
Goodwill amortization 9.4 5.2
Other (1.2) (1.0) (1.0)
Effective tax rate 35.5% 45.4% 41.4%
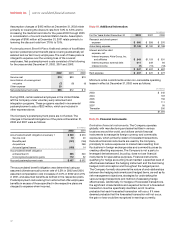
The tax effects of temporary differences that gave rise to deferred
income tax assets and liabilities consisted of the following at
December 31, 2002 and 2001:
(in millions)
2002 2001
Deferred income tax assets:
Accrued postretirement and
postemployment benefits $ 759 $ 774
Other 519 737
Total deferred income tax assets 1,278 1,511
Deferred income tax liabilities:
Trade names (3,839) (3,847)
Property, plant and equipment (1,515) (1,379)
Prepaid pension costs (841) (850)
Total deferred income tax liabilities (6,195) (6,076)
Net deferred income tax liabilities $(4,917) $(4,565)
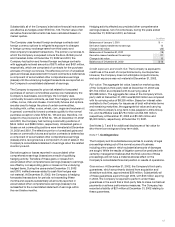
Note 13. Segment Reporting:
The Company manufactures and markets packaged retail food
products, consisting principally of beverages, cheese, snacks,
convenient meals and various packaged grocery products
through KFNA and KFI. Reportable segments for KFNA are
organized and managed principally by product category. KFNA’s
segments are Cheese, Meals and Enhancers; Biscuits, Snacks
and Confectionery; Beverages, Desserts and Cereals; and Oscar
Mayer and Pizza. KFNA’s food service business within the United
States and its businesses in Canada and Mexico are reported
through the Cheese, Meals and Enhancers segment. KFI’s
operations are organized and managed by geographic location.
KFI’s segments are Europe, Middle East and Africa; and Latin
America and Asia Pacific.
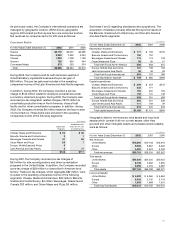
The Company’s management reviews operating companies
income to evaluate segment performance and allocate resources.
Operating companies income excludes general corporate
expenses and amortization of intangibles. Interest and other
debt expense, net, and provision for income taxes are centrally
managed and, accordingly, such items are not presented by
segment since they are excluded from the measure of segment
profitability reviewed by management. The Company’s assets,
which are principally in the United States and Europe, are
managed geographically. The accounting policies of the
segments are the same as those described in the Summary
of Significant Accounting Policies.
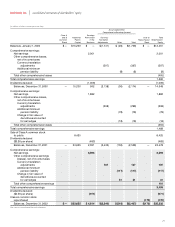
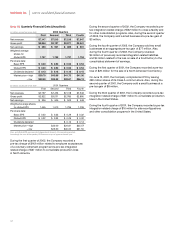
Reportable segment data were as follows:
(in millions)
For the Years Ended December 31, 2002 2001 2000
Net revenues:
Cheese, Meals and Enhancers $ 8,877 $ 8,732 $ 7,923
Biscuits, Snacks and Confectionery 5,182 5,071 293
Beverages, Desserts and Cereals 4,412 4,237 4,267
Oscar Mayer and Pizza 3,014 2,930 2,829
Total Kraft Foods North America 21,485 20,970 15,312
Europe, Middle East and Africa 6,203 5,936 6,398
Latin America and Asia Pacific 2,035 2,328 1,212
Total Kraft Foods International 8,238 8,264 7,610
Net revenues $29,723 $29,234 $22,922
Operating companies income:
Cheese, Meals and Enhancers $ 2,168 $ 2,099 $ 1,845
Biscuits, Snacks and Confectionery 1,093 966 100
Beverages, Desserts and Cereals 1,136 1,192 1,090
Oscar Mayer and Pizza 556 539 512
Total Kraft Foods North America 4,953 4,796 3,547
Europe, Middle East and Africa 962 861 1,019
Latin America and Asia Pacific 368 378 189
Total Kraft Foods International 1,330 1,239 1,208
Total operating companies income 6,283 6,035 4,755
Amortization of intangibles (7) (962) (535)
General corporate expenses (162) (189) (208)
Operating income 6,114 4,884 4,012
Interest and other debt expense, net (847) (1,437) (597)
Earnings before income taxes and
minority interest $ 5,267 $ 3,447 $ 3,415