Kraft 2002 Annual Report Download - page 40
Download and view the complete annual report
Please find page 40 of the 2002 Kraft annual report below. You can navigate through the pages in the report by either clicking on the pages listed below, or by using the keyword search tool below to find specific information within the annual report.-
 1
1 -
2
-
3
-
4
-
5
-
6
-
7
-
8
-
9
-
10
-
11
-
12
-
13
-
14
-
15
-
16
-
17
-
18
-
19
-
20
-
21
-
22
-
23
-
24
-
25
-
26
-
27
-
28
-
29
-
 30
30 -
 31
31 -
 32
32 -
 33
33 -
 34
34 -
 35
35 -
 36
36 -
 37
37 -
 38
38 -
 39
39 -
 40
40 -
 41
41 -
 42
42 -
 43
43 -
 44
44 -
 45
45 -
 46
46 -
 47
47 -
 48
48 -
 49
49 -
 50
50 -
51
-
52
-
53
-
54
-
55
-
56
-
57
-
58
-
59
-
60
-
61
-
62
-
63
-
64
-
65
-
66
-
67
-
68
-
69
-
70
 |
 |

kraft foods inc. management’s discussion and analysis of financial condition and results of operations
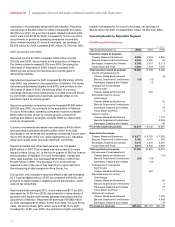
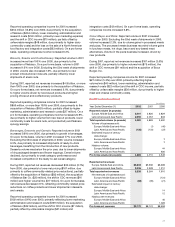
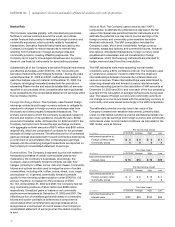
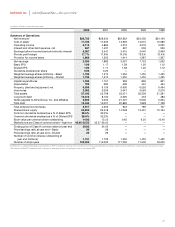
Kraft Foods International (continued)
(in millions)
Year Ended December 31, 2002 2001 2000
Reported operating
companies income:
Europe, Middle East and Africa $ 962 $ 861 $1,019
Latin America and Asia Pacific 368 378 189
Total reported operating
companies income 1,330 1,239 1,208
Gains on sales of businesses:
Europe, Middle East and Africa (139)
Latin America and Asia Pacific (72) (8)
Operating companies income of
businesses sold:
Europe, Middle East and Africa (32)
Latin America and Asia Pacific (10) (18) (3)
Integration costs:
Latin America and Asia Pacific 17
Separation programs:
Europe, Middle East and Africa 5
Latin America and Asia Pacific 2
Estimated impact of century
date change:
Europe, Middle East and Africa 8
Latin America and Asia Pacific 5
Nabisco operating
companies income:
Europe, Middle East and Africa 1
Latin America and Asia Pacific 70
Pro forma operating
companies income $1,272 $1,213 $1,118
2002 compared with 2001
KFI’s reported volume for 2002 increased 2.8% over 2001. On a
pro forma basis, volume for 2002 increased 3.7% over 2001, due
primarily to acquisitions, new product introductions, geographic
expansion and marketing programs. This increase in volume was
partially offset by the impact of economic weakness in several
Latin American countries.
During 2002, reported net revenues decreased $26 million
(0.3%) from 2001, due primarily to unfavorable currency
movements ($271 million), lower volume/mix ($36 million) and
revenues of divested businesses ($22 million), partially offset
by the impact of acquisitions ($181 million) and higher net
pricing ($122 million). On a pro forma basis, net revenues
decreased slightly.
Reported operating companies income for 2002 increased
$91 million (7.3%) over 2001, due primarily to gains on sales of
businesses ($64 million), favorable margins ($37 million, including
productivity savings), lower marketing, administration and
research costs ($23 million, including synergy savings) and the
impact of acquisitions ($18 million), partially offset by lower
volume/mix ($19 million), 2002 integration costs ($17 million) and
income of divested businesses ($8 million). On a pro forma
basis, operating companies income increased 4.9%, driven
by productivity and synergy savings, partially offset by lower
volume/mix.
The following discusses operating results within each of KFI’s
reportable segments.
Europe, Middle East and Africa: Reported and pro forma
volume for 2002 increased 4.8% over 2001, driven by acquisitions
and volume growth across most markets including Italy, the
United Kingdom, Sweden, the Ukraine, the Middle East and
Poland, partially offset by declines in Germany and Romania.
Snacks volume increased, benefiting from confectionery
acquisitions in Russia and Poland, a snacks acquisition in Turkey
and new product introductions across the segment. Snacks
volume growth was moderated by a decline in Germany,
reflecting aggressive competitive activity, and in Romania, due
to lower consumer purchasing power. In beverages, volume
increased in both coffee and refreshment beverages. Coffee
volume grew in most markets, driven by new product
introductions, and acquisitions in Romania, Morocco and
Bulgaria. In Germany, coffee volume decreased, reflecting
market softness and increased price competition. Refreshment
beverages volume also increased, driven by the geographic
expansion of powdered beverages and new product
introductions. Cheese volume increased with gains in
Philadelphia cream cheese, benefiting from advertising and new
product introductions. In convenient meals, volume increased,
due primarily to higher canned meats volume in Italy against a
weak comparison in 2001, and new product introductions of lunch
combinations in the United Kingdom.
Reported and pro forma net revenues for 2002 increased
$267 million (4.5%) over 2001, due primarily to favorable
currency movements ($197 million), the acquisitions of coffee,
confectionery and snacks businesses ($147 million) and higher
volume/mix ($22 million), partially offset by lower net pricing
($99 million, due primarily to commodity-driven coffee
price declines).
Reported operating companies income for 2002 increased
$101 million (11.7%) over 2001, due primarily to favorable margins
($42 million), favorable currency movements ($37 million), higher
volume/mix ($19 million) and acquisitions ($16 million), partially
offset by higher marketing, administration and research costs. On
a pro forma basis, operating companies income increased 12.3%.
Latin America and Asia Pacific: Reported volume for 2002
increased slightly over 2001. On a pro forma basis, volume for
2002 increased 2.1% over 2001, driven by the acquisition of a
biscuits business in Australia and gains across numerous
markets, partially offset by a volume decline in Argentina due
to economic weakness, and lower results in China. In snacks,
volume growth was driven by gains in biscuits, benefiting from
geographic expansion of cookies and crackers in Latin America,
new product introductions and the acquisition of a biscuits
business in Australia. Snacks volume growth was partially offset
by the negative impact of the continued economic weakness
in Argentina and distributor inventory reductions in China.
Beverages volume also increased, due primarily to growth in
powdered beverages in numerous markets across Latin America
36