Kraft 2002 Annual Report Download - page 24
Download and view the complete annual report
Please find page 24 of the 2002 Kraft annual report below. You can navigate through the pages in the report by either clicking on the pages listed below, or by using the keyword search tool below to find specific information within the annual report.-
 1
1 -
2
-
3
-
4
-
5
-
6
-
7
-
8
-
9
-
10
-
11
-
12
-
13
-
 14
14 -
 15
15 -
 16
16 -
 17
17 -
 18
18 -
 19
19 -
 20
20 -
 21
21 -
 22
22 -
 23
23 -
 24
24 -
 25
25 -
 26
26 -
 27
27 -
 28
28 -
 29
29 -
 30
30 -
 31
31 -
 32
32 -
 33
33 -
 34
34 -
35
-
36
-
37
-
38
-
39
-
40
-
41
-
42
-
43
-
44
-
45
-
46
-
47
-
48
-
49
-
50
-
51
-
52
-
53
-
54
-
55
-
56
-
57
-
58
-
59
-
60
-
61
-
62
-
63
-
64
-
65
-
66
-
67
-
68
-
69
-
70
 |
 |

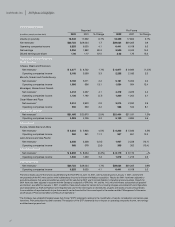
Consolidated Results
Reported Pro Forma
(in millions, except per share data) 2002 2001 % Change 2002 2001 % Change
Volume (in pounds) 18,549 17,392 6.7% 18,399 17,852 3.1%
Net revenues* $29,723 $29,234 1.7 $29,634 $29,365 0.9
Operating companies income 6,283 6,035 4.1 6,441 6,108 5.5
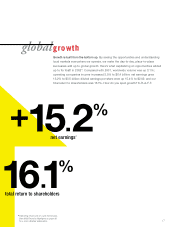
Net earnings 3,394 1,882 80.3 3,505 3,042 15.2
Diluted earnings per share 1.96 1.17 67.5 2.02 1.75 15.4
Results by Business Segment
North America
Cheese, Meals and Enhancers
Net revenues* $ 8,877 $ 8,732 1.7% $ 8,877 $ 8,984 (1.2)%
Operating companies income 2,168 2,099 3.3 2,258 2,185 3.3
Biscuits, Snacks and Confectionery
Net revenues* 5,182 5,071 2.2 5,161 5,052 2.2
Operating companies income 1,093 966 13.1 1,084 964 12.4
Beverages, Desserts and Cereals
Net revenues* 4,412 4,237 4.1 4,412 4,225 4.4
Operating companies income 1,136 1,192 (4.7) 1,239 1,202 3.1
Oscar Mayer and Pizza
Net revenues* 3,014 2,930 2.9 3,014 2,930 2.9
Operating companies income 556 539 3.2 588 544 8.1
Total North America
Net revenues* $21,485 $20,970 2.5% $21,464 $21,191 1.3%
Operating companies income 4,953 4,796 3.3 5,169 4,895 5.6
International
Europe, Middle East and Africa
Net revenues* $ 6,203 $ 5,936 4.5% $ 6,203 $ 5,936 4.5%
Operating companies income 962 861 11.7 967 861 12.3
Latin America and Asia Pacific
Net revenues* 2,035 2,328 (12.6) 1,967 2,238 (12.1)
Operating companies income 368 378 (2.6) 305 352 (13.4)
Total International
Net revenues* $ 8,238 $ 8,264 (0.3%) $ 8,170 $ 8,174
—
%
Operating companies income 1,330 1,239 7.3 1,272 1,213 4.9
Total Kraft Foods
Net revenues* $29,723 $29,234 1.7% $29,634 $29,365 0.9%
Operating companies income 6,283 6,035 4.1 6,441 6,108 5.5
Pro forma results assume that shares issued following the Kraft IPO on June 13, 2001, were outstanding since January 1, 2001, and that the
net proceeds of the IPO were used to retire indebtedness incurred to finance the Nabisco acquisition. Results for 2001 have been adjusted to
exclude businesses that were reclassified as assets held for sale during 2001 and to include Nabisco’s Canadian grocery business. Results for
2001 have also been adjusted to assume that the Company’s adoption of SFAS No. 141 and No. 142, which eliminates substantially all goodwill
amortization, was effective January 1, 2001. In addition, these results adjust for certain items, including charges associated with reconfigurations
and consolidation as Kraft and Nabisco are integrated and, due to the recent gains on divestitures, all gains and losses on sales of businesses.
A reconciliation of reported results to pro forma results can be found within this annual report in the section entitled “Management’s Discussion
and Analysis of Financial Condition and Results of Operations.”
* The Company has adopted Emerging Issues Task Force (“EITF”) statements relating to the classification of vendor consideration and certain sales
incentives. Prior period data has been restated. The adoption of the EITF statements has no impact on operating companies income, net earnings
or diluted earnings per share.
kraft foods inc. 2002 financial highlights
20