Kraft 2002 Annual Report Download - page 19
Download and view the complete annual report
Please find page 19 of the 2002 Kraft annual report below. You can navigate through the pages in the report by either clicking on the pages listed below, or by using the keyword search tool below to find specific information within the annual report.-
 1
1 -
2
-
3
-
4
-
5
-
6
-
7
-
8
-
 9
9 -
 10
10 -
 11
11 -
 12
12 -
 13
13 -
 14
14 -
 15
15 -
 16
16 -
 17
17 -
 18
18 -
 19
19 -
 20
20 -
 21
21 -
 22
22 -
 23
23 -
 24
24 -
 25
25 -
 26
26 -
 27
27 -
 28
28 -
 29
29 -
30
-
31
-
32
-
33
-
34
-
35
-
36
-
37
-
38
-
39
-
40
-
41
-
42
-
43
-
44
-
45
-
46
-
47
-
48
-
49
-
50
-
51
-
52
-
53
-
54
-
55
-
56
-
57
-
58
-
59
-
60
-
61
-
62
-
63
-
64
-
65
-
66
-
67
-
68
-
69
-
70
 |
 |

17
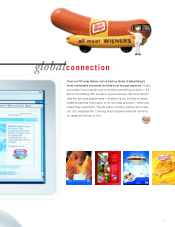
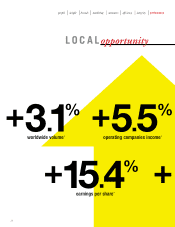
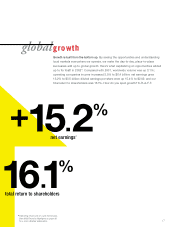
Growth is built from the bottom up. By seeing the opportunities and understanding
local markets everywhere we operate, we make the day-to-day, place-to-place
successes add up to global growth. Here’s what capitalizing on opportunities added
up to for Kraft in 2002*: Compared with 2001, worldwide volume was up 3.1%;
operating companies income increased 5.5% to $6.4 billion; net earnings grew
15.2% to $3.5 billion; diluted earnings per share were up 15.4% to $2.02; and our
total return to shareholders was 16.1%. How do you spell growth? K-R-A-F-T.
*Operating results are on a pro forma basis.
See 2002 Financial Highlights on page 20
for a more detailed explanation.
globalgrowth
16
.
1
%
net earnings*
total return to shareholders
+
15
.
2
%