Kodak 2000 Annual Report Download - page 65
Download and view the complete annual report
Please find page 65 of the 2000 Kodak annual report below. You can navigate through the pages in the report by either clicking on the pages listed below, or by using the keyword search tool below to find specific information within the annual report.-
 1
1 -
2
-
3
-
4
-
5
-
6
-
7
-
8
-
9
-
10
-
11
-
12
-
13
-
14
-
15
-
16
-
17
-
18
-
19
-
20
-
21
-
22
-
23
-
24
-
25
-
26
-
27
-
28
-
29
-
30
-
31
-
32
-
33
-
34
-
35
-
36
-
37
-
38
-
39
-
40
-
41
-
42
-
43
-
44
-
45
-
46
-
47
-
48
-
49
-
50
-
51
-
52
-
53
-
54
-
 55
55 -
 56
56 -
 57
57 -
 58
58 -
 59
59 -
 60
60 -
 61
61 -
 62
62 -
 63
63 -
 64
64 -
 65
65 -
 66
66 -
 67
67 -
 68
68 -
 69
69 -
 70
70 -
 71
71 -
 72
72 -
 73
73 -
 74
74 -
 75
75 -
76
-
77
-
78
-
79
-
80
-
81
-
82
-
83
-
84
-
85
-
86
-
87
-
88
-
89
-
90
-
91
-
92
-
93
-
94
-
95
-
96
-
97
-
98
-
99
-
100
-
101
-
102
-
103
-
104
-
105
-
106
-
107
-
108
-
109
-
110
 |
 |

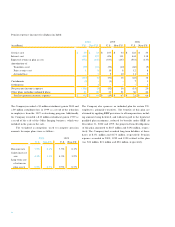
(Dollar amounts and shares in millions, except per share data) 2 0 0 0 1 9 9 9 1 9 9 8 1 9 9 7 1 9 9 6
Sales from continuing operations $1 3 , 9 9 4 $1 4 , 0 8 9 $ 1 3 , 4 0 6 $ 1 4 , 5 3 8 $ 1 5 , 9 6 8
E a rnings from operations 2 , 2 1 4 1 , 9 9 0 1 , 8 8 8 1 3 0 1 , 8 4 5
E a rnings from continuing operations after tax 1 , 4 0 7( 1 ) 1 , 3 9 2(2) 1 , 3 9 0( 3 ) 5( 5 ) 1 , 0 1 1( 7 )
E a rnings from discontinued operations after tax –– – – 2 7 7
Net earn i n g s 1 , 4 0 7( 1 ) 1 , 3 9 2( 2 ) 1 , 3 9 0( 3 ) 5( 5 ) 1 , 2 8 8( 7 )
E a rnings and Dividends
Net earn i n g s
— % of sales 1 0 . 1 % 9 . 9 % 1 0 . 4 % 0 . 0 % 8 . 1 %
— % re t u rn on average shareholders ’ equity 3 8 . 3 % 3 5 . 2 % 3 8 . 9 % 0 . 1 % 2 6 . 1 %
Basic earnings per share 4 . 6 2 4 . 3 8 4 . 3 0 . 0 1 3 . 8 2( 8 )
Diluted earnings per share 4 . 5 9 4 . 3 3 4 . 2 4 . 0 1 3 . 7 6( 8 )
Cash dividends declare d
— on common share s 5 3 3 5 6 0 5 7 0 5 7 7 5 3 9
— per common share 1 . 7 6 1 . 7 6 1 . 7 6 1 . 7 6 1 . 6 0
Common shares outstanding at year end 2 9 0 . 5 3 1 0 . 4 3 2 2 . 8 3 2 3 . 1 3 3 1 . 8
S h a reholders at year end 1 1 3 , 3 0 8 1 3 1 , 7 1 9 1 2 9 , 4 9 5 1 3 5 , 1 3 2 1 3 7 , 0 9 2
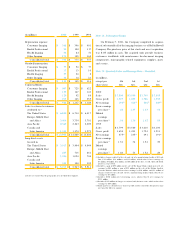
Statement of Financial Position Data
Working capital( 9 ) $1 , 4 8 2 $8 3 8 $ 9 3 9 $ 9 0 9 $ 2 , 0 8 9
P ro p e rties — net 5 , 9 1 9 5 , 9 4 7 5 , 9 1 4 5 , 5 0 9 5 , 4 2 2
Total assets 1 4 , 2 1 2 1 4 , 3 7 0 1 4 , 7 3 3 1 3 , 1 4 5 1 4 , 4 3 8
S h o rt - t e rm borro w i n g s 2 , 2 0 6 1 , 1 6 3 1 , 5 1 8 6 1 1 5 4 1
L o n g - t e rm borro w i n g s 1 , 1 6 6 9 3 6 5 0 4 5 8 5 5 5 9
Total shareholders’ equity 3 , 4 2 8 3 , 9 1 2 3 , 9 8 8 3 , 1 6 1 4 , 7 3 4
Supplemental Inform a t i o n
S a l e s — Consumer Imaging $7 , 4 0 6 $7 , 4 1 1 $ 7 , 1 6 4 $ 7 , 6 8 1 $ 7 , 6 5 9
— Kodak Pro f e s s i o n a l 1 , 7 0 6 1 , 9 1 0 1 , 8 4 0 2 , 2 7 2 2 , 3 6 7
— Health Imaging 2 , 1 8 5 2 , 1 2 0 1 , 5 2 6 1 , 5 3 2 1 , 6 2 7
— Other Imaging 2 , 6 9 7 2 , 6 4 8 2 , 8 7 6 3 , 0 5 3 4 , 3 1 5
R e s e a rch and development costs 7 8 4( 2 ) 8 1 7 9 2 2( 4 ) 1 , 2 3 0( 6 ) 1 , 0 2 8
D e p re c i a t i o n 7 3 8 7 7 3 7 3 7 7 4 8 8 3 7
Taxes (excludes payroll, sales and excise taxes) 9 3 3 8 0 6 8 0 9 1 6 4 6 6 3
Wages, salaries and employee benefits 3 , 7 2 6 3 , 9 6 2 4 , 3 0 6 4 , 9 8 5 5 , 1 1 0
Employees at year end
— in the U.S. 4 3 , 2 0 0 4 3 , 3 0 0 4 6 , 3 0 0 5 4 , 8 0 0 5 3 , 4 0 0
— worldwide 7 8 , 4 0 0 8 0 , 6 5 0 8 6 , 2 0 0 9 7 , 5 0 0 9 4 , 8 0 0
( 1 ) Includes charges related to the sale and exit of a manufacturing facility of $50 million, which reduced net earnings by $33 million.
( 2 ) Includes $350 million of re s t ructuring charges, which reduced net earnings by $231 million, and an additional $11 million of charges related to this re s t ructuring pro g r a m ,
which reduced net earnings by $7 million; $103 million of charges associated with business exits, which reduced net earnings by $68 million; a gain of $95 million on the sale
of The Image Bank, which increased net earnings by $63 million; and a gain of $25 million on the sale of the Motion Analysis Systems Division, which increased net earn i n g s
by $16 million.
( 3 ) Includes $35 million of litigation charges, which reduced net earnings by $23 million; $132 million of Office Imaging charges, which reduced net earnings by $87 million;
$45 million primarily for a write-off of in-process R&D associated with the Imation acquisition, which reduced net earnings by $30 million; a gain of $87 million on the s ale of
NanoSystems, which increased net earnings by $57 million; and a gain of $66 million on the sale of part of the Company’s investment in Gretag, which increased net earn i n g s
by $44 million.
( 4 ) Includes a $42 million charge for the write-off of in-process R&D associated with the Imation acquisition.
( 5 ) Includes $1,455 million of re s t ructuring cos ts, asset impairments and other charges, which reduced net earnings by $990 million; $186 million for a write-off of in-pro c e s s
R&D associated with the Wang acquisition, which reduced net earnings by $123 million; and a $46 million litigation charge, which reduced net earnings by $30 million.
( 6 ) Includes a $186 million charge for the write-off of in-process R&D associated with the Wang acquisition.
( 7 ) Includes $358 million of re s t ructuring costs, which reduced net earnings by $256 million, and a $387 million loss related to the sale of the Office Imaging business, which
reduced net earnings by $252 million.
( 8 ) Basic and diluted earnings per share from continuing operations were $3.00 and $2.95, re s p e c t i v e l y.
( 9 ) Excludes short - t e rm borro w i n g s .
64
Eastman Kodak Company and Subsidiary Companies
S u m m a ry of Operating Data