Kodak 2000 Annual Report Download - page 28
Download and view the complete annual report
Please find page 28 of the 2000 Kodak annual report below. You can navigate through the pages in the report by either clicking on the pages listed below, or by using the keyword search tool below to find specific information within the annual report.-
 1
1 -
2
-
3
-
4
-
5
-
6
-
7
-
8
-
9
-
10
-
11
-
12
-
13
-
14
-
15
-
16
-
17
-
 18
18 -
 19
19 -
 20
20 -
 21
21 -
 22
22 -
 23
23 -
 24
24 -
 25
25 -
 26
26 -
 27
27 -
 28
28 -
 29
29 -
 30
30 -
 31
31 -
 32
32 -
 33
33 -
 34
34 -
 35
35 -
 36
36 -
 37
37 -
 38
38 -
39
-
40
-
41
-
42
-
43
-
44
-
45
-
46
-
47
-
48
-
49
-
50
-
51
-
52
-
53
-
54
-
55
-
56
-
57
-
58
-
59
-
60
-
61
-
62
-
63
-
64
-
65
-
66
-
67
-
68
-
69
-
70
-
71
-
72
-
73
-
74
-
75
-
76
-
77
-
78
-
79
-
80
-
81
-
82
-
83
-
84
-
85
-
86
-
87
-
88
-
89
-
90
-
91
-
92
-
93
-
94
-
95
-
96
-
97
-
98
-
99
-
100
-
101
-
102
-
103
-
104
-
105
-
106
-
107
-
108
-
109
-
110
 |
 |

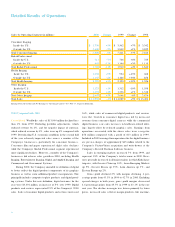
(Dollar amounts and shares in millions, except per share data) 2 0 0 0( 1 ) 1 9 9 9( 2 )
Stock price per share at year end $3 9 . 3 8 $6 6 . 2 5
S a l e s $1 3 , 9 9 4 $1 4 , 0 8 9
E a rnings from operations $2 , 2 1 4 $1 , 9 9 0
Net earn i n g s $1 , 4 0 7 $1 , 3 9 2
Basic earnings per share $4 . 6 2 $4 . 3 8
Diluted earnings per share $4 . 5 9 $4 . 3 3
Cash dividends declare d $5 3 3 $5 6 0
—per common share $1 . 7 6 $1 . 7 6
Average number of common shares outstanding 3 0 4 . 9 3 1 8 . 0
S h a reholders at year end 1 1 3 , 3 0 8 1 3 1 , 7 1 9
Total shareholders’ equity $3 , 4 2 8 $3 , 9 1 2
Additions to pro p e rt i e s $9 4 5 $1 , 1 2 7
D e p re c i a t i o n $7 3 8 $7 7 3
Wages, salaries and employee benefits $3 , 7 2 6 $3 , 9 6 2
Employees at year end
—in the U.S. 4 3 , 2 0 0 4 3 , 3 0 0
— w o r l d w i d e 7 8 , 4 0 0 8 0 , 6 5 0
( 1 )Results for the year included charges related to the sale and exit of a manufacturing facility of $50 million, which reduced net earnings by $33 million. Excluding this
item, net earnings were $1,44 0 million. Basic and dilute d earnings per share were $4.73 and $4.70, re s p e c t i v e l y.
( 2 ) Results for the year included $350 million of re s t ructuring charges, which reduced net earnings by $231 million, and an additional $11 million of charges related to this re s t ru c-
turing program, which reduced net earnings by $7 million; $103 million of charges associated with business exits, which reduced net earnings by $68 million; a gain of $95 mil-
lion on the sale of The Image Bank, which increased net earnings by $63 million; and a gain of $25 million on the sale of the Motion Analysis Systems Division, which incre a s e d
net earnings by $16 million. Excluding these items, net earnings were $1,619 million. Basic and diluted earnings per share were $5.09 and $5.03, re s p e c t i v e l y.
Financial Highlights