Kodak 2000 Annual Report Download - page 35
Download and view the complete annual report
Please find page 35 of the 2000 Kodak annual report below. You can navigate through the pages in the report by either clicking on the pages listed below, or by using the keyword search tool below to find specific information within the annual report.-
 1
1 -
2
-
3
-
4
-
5
-
6
-
7
-
8
-
9
-
10
-
11
-
12
-
13
-
14
-
15
-
16
-
17
-
18
-
19
-
20
-
21
-
22
-
23
-
24
-
 25
25 -
 26
26 -
 27
27 -
 28
28 -
 29
29 -
 30
30 -
 31
31 -
 32
32 -
 33
33 -
 34
34 -
 35
35 -
 36
36 -
 37
37 -
 38
38 -
 39
39 -
 40
40 -
 41
41 -
 42
42 -
 43
43 -
 44
44 -
 45
45 -
46
-
47
-
48
-
49
-
50
-
51
-
52
-
53
-
54
-
55
-
56
-
57
-
58
-
59
-
60
-
61
-
62
-
63
-
64
-
65
-
66
-
67
-
68
-
69
-
70
-
71
-
72
-
73
-
74
-
75
-
76
-
77
-
78
-
79
-
80
-
81
-
82
-
83
-
84
-
85
-
86
-
87
-
88
-
89
-
90
-
91
-
92
-
93
-
94
-
95
-
96
-
97
-
98
-
99
-
100
-
101
-
102
-
103
-
104
-
105
-
106
-
107
-
108
-
109
-
110
 |
 |
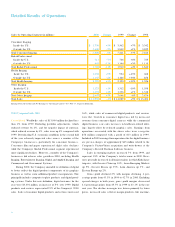
i n c reased sales of digitization services and 35mm film, which
i n c reased both on a dollar and unit basis.
SG&A expenses for the segment were in line with 1999 in
dollar terms but increased as a percentage of sales, from 18.1%
to 20.3% . Excluding advertising expenses, S G&A expenses
i n c reased 1%, from 15.9% of sales to 18.0% . R&D s pending
d e c reased 10% in dollar terms, but remained level on a perc e n t-
age of sales basis at 7.4% . The decrease is primarily due to the
reclassification of NexPress R&D costs to below earnings fro m
operations upon the formation of the NexPress joint venture in
1999. Excluding this reclassification, R&D decreased 2%.
E a rnings from operations decreased 30% , while net earn-
ings declined 58% . Included in 1999 earnings from operations
is a $20 million pre-tax charge related to the write-off of the
C o m p a n y ’s investment in CalComp Corporation. Excluding this
c h a rge, other income (charges) decreased $141 million from a
positive $48 million in 1999 to a negative $93 million in 2000, pri-
marily reflecting a reduction in joint venture income from KPG
and the reclassification of NexPress R&D.
Health Imaging Sales in the Health Imaging segment incre a s e d
3% from the prior year, or 6% excluding the adverse effect of cur-
rency movements. Sales inside the U.S. increased 9%, while
sales outside the U.S. decreased 2% , des pite an increase of 7%
in emerging market sales. Excluding negative exchange move-
ments, sales outside the U.S . increased 4% .
Sales of digital products (including laser printers, digital
media, digital capture equipment and Picture Archiving and
Communication S ystems (PACS )) increased 11% over fiscal
1999. Placements of Dry View laser imagers increased 67% in
2000. Dry View media sales increased 48% on higher volumes,
while digital capture products and PACS increased 51% . The
g rowth in these digital product lines was partially mitigated by
an expected decline in wet laser imaging sales.
Sales of traditional medical products, including analog film,
equipment, chemistry and services, declined 3% for the year
but were flat when adjusted for exchange. For traditional analog
film (excluding specialty films), year- o v e r-year sales declined
6% reflecting flat volumes, unfavorable exchange and antici-
pated price declines. Mammography and Oncology s pecialty
p roducts grew by 12% primarily on higher volumes, while sales
of dental products increased 5% on slightly higher volumes and
favorable pricing.
S G&A expens es for the segment decreased 6% , fro m
20.0% of sales in 1999 to 18.2% in 2000. Excluding advert i s i n g
expenses, S G&A expenses decreased 8% , from 19.1% of sales
to 17.1% , reflecting the benefits of cost control initiatives and the
continued successful integration of the Imation bus iness acquire d
in December 1998. R&D expenses increased 5% , from 6.0% of
sales in 1999 to 6.2% in 2000.
E a rnings from operations increased 7% , as higher sales
and lower SG&A costs more than offset increased R&D spend-
ing. Segment net earnings increased 10% , from $315 million to
$346 million.
Other Imaging Sales in the Other Imaging segment incre a s e d
2% from the prior year, or 5% excluding exchange. Adjusting for
the impact of portfolio changes, segment sales were up 10% .
Sales growth in 2000 was led by strong digital camera sales and
i n c reased sales perf o rmance in the Commercial & Govern m e n t
Systems unit. Sales of motion picture film and services also
i n c reased, reflecting the motion picture film industry ’s re c o v e ry
f rom the softness of a year ago. U.S . sales increased 1% , while
sales outs ide the U.S. were up 3% , but up 9% excluding
e x c h a n g e .
Consumer digital camera sales increased 26% with over
70% higher unit volumes partially offset by lower prices that
reflect the competitiveness of this business. U.S. digital camera
sales grew by 17% while came ra s ales outside the U.S .
i n c reased 38% , both reflecting higher unit volumes and lower
p r i c e s .
SG &A expenses for the segment decreased 12% , fro m
20.6% of sales in 1999 to 17.7% in 2000. Adjusting for special
c h a rges taken in 1999, SG&A expenses declined 8% . Excluding
a d v e rtising expenses , SG&A expenses decreased 17% , fro m
17.4% of sales to 14.2% . Current-year SG&A expenses included
c h a rges of approximately $23 million primarily related to the
C o m p a n y ’s Picture Vision acquisition and write-downs at the
C o m p a n y ’s divested Eastman Software business, while prior year
included SG &A from divested business es . R&D expens es
i n c reased 1% in dollar terms, but were level on a percentage of
sales basis at 7.7% . R&D expenses in 2000 include appro x i-
mately $10 million of charges for the write-off of in-process R&D
related to the Picture Vision acquisition.
E a rnings from operations were $227 million, which is $30
million or 15% higher than 1999. Excluding special charges in
both years, earnings from operations of $237 million decre a s e d
$45 million, or 16% year over year. The lower earnings are pri-
marily due to lower prices on consumer digital cameras and CD
media, and adverse currency movements, which more than off s e t
SG&A savings . Net earnings for the segment were $161 million,
a decrease of 27% from the prior year reflecting lower earn i n g s
f rom operations in 2000 and the inclusion of gains from port f o l i o
actions in 1999.
34