Kodak 2000 Annual Report Download - page 34
Download and view the complete annual report
Please find page 34 of the 2000 Kodak annual report below. You can navigate through the pages in the report by either clicking on the pages listed below, or by using the keyword search tool below to find specific information within the annual report.-
 1
1 -
2
-
3
-
4
-
5
-
6
-
7
-
8
-
9
-
10
-
11
-
12
-
13
-
14
-
15
-
16
-
17
-
18
-
19
-
20
-
21
-
22
-
23
-
 24
24 -
 25
25 -
 26
26 -
 27
27 -
 28
28 -
 29
29 -
 30
30 -
 31
31 -
 32
32 -
 33
33 -
 34
34 -
 35
35 -
 36
36 -
 37
37 -
 38
38 -
 39
39 -
 40
40 -
 41
41 -
 42
42 -
 43
43 -
 44
44 -
45
-
46
-
47
-
48
-
49
-
50
-
51
-
52
-
53
-
54
-
55
-
56
-
57
-
58
-
59
-
60
-
61
-
62
-
63
-
64
-
65
-
66
-
67
-
68
-
69
-
70
-
71
-
72
-
73
-
74
-
75
-
76
-
77
-
78
-
79
-
80
-
81
-
82
-
83
-
84
-
85
-
86
-
87
-
88
-
89
-
90
-
91
-
92
-
93
-
94
-
95
-
96
-
97
-
98
-
99
-
100
-
101
-
102
-
103
-
104
-
105
-
106
-
107
-
108
-
109
-
110
 |
 |
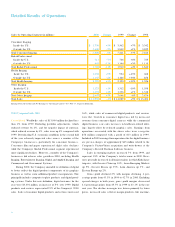
use cameras and consumer digital cameras, and the negative
impact of exchange. Productivity gains that were recognized ear-
lier in the year were partially offset during the fourth quarter as
the Company reduced inventories in the face of slowing demand
and retailer inventory re d u c t i o n s .
S elling, general and adminis trative (SG &A) expenses
d e c reased 10% from 23.4% of sales in 1999 to 21.3% in 2000.
Excluding special charges in 1999, SG&A decreased 6% fro m
the prior year from 22.5% of sales to 21.3% . The reduction in
SG&A expenses primarily reflects the success of the Company’s
cost reduction initiatives and portfolio actions .
R&D expenses decreased 4% during the year from 5.8% of
sales in 1999 to 5.6% in 2000. This decline primarily reflects the
benefit of portfolio actions, primarily the divestiture of Eastman
S o f t w a re .
E a rnings from operations increased 11% or $224 million in
2000. Adjusting for special charges in both years, earnings fro m
operations declined $190 million or 8% as increased sales vol-
umes in many of the Company’s businesses and the success of
cost savings initiatives did not offset lower effective selling prices
and adverse currency movements.
I n t e rest expense increased 25% over 1999 reflecting higher
average borrowing and rising interest rates. Other income
d e c reased by $165 million or 63% from 1999 due largely to the
inclusion of gains of $120 million from the sale of the Image Bank
and Motion Analysis Systems Division in 1999. Excluding the
gains from the sale of these businesses, other income declined
$45 million, primarily reflecting lower equity earnings from the
C o m p a n y ’s Kodak Polychrome Graphics (KPG) joint venture .
The effective tax rate for both 2000 and 1999 was 34%.
Consumer Imaging Sales in the Consumer Imaging segment of
$7,406 were essentially flat compared with 1999, as incre a s e d
volumes were offset by lower prices and advers e curre n c y
movements. Excluding unfavorable exchange movements, sales
i n c reased 3% . U.S. sales increased 5% while sales outside the
U.S. declined by 5% , but increased 2% excluding the unfavor-
able effect of exchange movements.
Worldwide film sales (including 35mm film, Advantix film, and
one-time-use cameras) decreased 1% from 1999 as incre a s e d
volumes in all major categories could not offset pricing pre s s u re s
and adverse currency movements. U.S. film sales increased 2%
primarily due to volume increases of 17% in one-time-use cam-
eras and 15% in Advantix film. The Company successfully held
total film market share in the U.S. for the 3rd consecutive year.
Outside the U.S., film sales to dealers declined 3% as incre a s e d
volumes were offset by lower prices and negative currency move-
m e n t s .
T h roughout 2000, the Company continued to successfully
shift consumers to the diff e r entiated, higher value MAX and
Advantix product lines. By the fourth quart e r , combined U.S. sales
of MAX and Advantix films grew to more than 62% of total U.S.
consumer roll film revenues, up 6 percentage points over year-
end 1999.
Worldwide paper sales declined 3% in 2000 as volume
gains could not offset lower prices and negative exchange. U.S.
paper sales increased by 1% , as 3% volume increases off s e t
lower prices. Outside the U.S., paper sales decreased 5% as
i n c reased volumes could not offset lower prices and negative
exchange movements.
The penetration rate for the number of rolls scanned at Qualex
wholesale laboratories averaged 4.1% for the full year, equivalent
to approximately 260 million scanned images. By the end of 2000,
the number of placements of Kodak Picture Maker kiosks was over
29,000, an increase of 6,000 from year-end 1999.
SG&A expenses for the segment decreased 6% , from 25.2%
of sales in 1999 to 23.7% in 2000, reflecting the benefits of the
C o m p a n y ’s cost reduction eff o rts. SG&A excluding advert i s i n g
d e c reased 6%, from 17.5% of sales in 1999 to 16.4% in 2000.
R&D expenses decreased 9% , from 4.7% of sales in 1999 to
4.3% in 2000.
E a rnings from operations decreased 9% , reflecting re d u c e d
p rofit margins driven primarily by lower effective selling prices,
unfavorable product mix and adverse exchange movements.
Lower gross profit was partially offset by reduced SG&A and
R&D spending. Net earnings were $860 million, which reflects a
4% decrease from the prior year, due primarily to lower earn i n g s
f rom operations.
Kodak Pro f e s s i o n a l Sales in the Kodak Professional segment
d e c reased 11% from 1999, 8% excluding adverse curre n c y
movements. Adjusting the year- o v e r-year comparison for the
impact of the formation of the KPG joint venture in Japan, sales
declined 9%. U.S. revenues decreased 7% and revenues out-
side the U.S. decreased 13%, or 8% excluding the unfavorable
impact of exchange.
Total commercial products revenue declined 14% primarily
due to lower sensitized film and paper sales, as well as declines
in professional digital camera sales, all of which suff e red fro m
volume declines and pricing pre s s u re. The graphics business also
experienced revenue declines of approximately 26% , due to
reduced sales to the Company’s KPG joint venture. The seg-
m e n t ’s Portrait/S ocial bus ine ss incre ased 2% re f l e c t i n g