Kodak 2000 Annual Report Download - page 32
Download and view the complete annual report
Please find page 32 of the 2000 Kodak annual report below. You can navigate through the pages in the report by either clicking on the pages listed below, or by using the keyword search tool below to find specific information within the annual report.
2 0 0 0
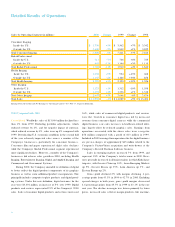
The Company’s results for the year included the following:
P re-tax charges of approximately $50 million ($33 million
after tax) associated with the sale and exit of one of the Com-
p a n y ’s equipment manufacturing facilities. The costs for this
e f f o rt, which began in 1999, related to accelerated depre c i a t i o n
of assets still in use prior to the sale of the facility in the second
q u a rt e r, and costs for relocation of the operations. Additional re l o-
cation costs of approximately $10 million pre-tax, per quart e r, will
be re c o rded through the first half of 2001 in connection with
these actions.
Excluding the above, net earnings were $1,440 million. Basic
e a rnings per share were $4.73 and diluted earnings per share
w e re $4.70.
1 9 9 9
The Company’s results for the year included the following:
A pre-tax re s t ructuring charge of $350 million ($231 million
after tax) related to worldwide manufacturing and photofinishing
consolidation and reductions in selling, general and administra-
tive positions worldwide. See Note 11, Restructuring Pro g r a m s
and Cost Reduction. In addition, the Company incurred pre - t a x
c h a rges of $11 million ($7 million after tax) related to accelerated
d e p reciation of assets still in use during 1999 and sold in 2000,
in connection with the exit of one of the Company’s equipment
manufacturing facilities.
P re-tax charges totaling approximately $103 million ($68 mil-
lion after tax) associated with the exits of the Eastman Software
business ($51 million pre-tax) and Entertainment Imaging’s sticker
print kiosk product line ($32 million pre-tax) as well as the write-
o ff of the Company’s Calcomp investment ($20 million pre - t a x ) ,
which was determined to be unre c o v e r a b l e .
P re-tax gains of approximately $120 million ($79 million after
tax) related to the sale of The Image Bank ($95 million pre - t a x
gain) and the Motion Analysis Systems Division ($25 million pre -
tax gain). See Note 16, Sales of Assets and Divestiture s .
Excluding the above items, net earnings were $1,619 million.
Basic earnings per share were $5.09 and diluted earnings per
s h a re were $5.03.
1 9 9 8
The Company’s results for the year included the following:
The sales of its NanoSystems subsidiary and a portion of
the Company’s investment in Gretag Imaging Group (Gre t a g ) ,
resulting in pre-tax gains of $87 and $66 million ($57 a nd
$44 million after tax), re s p e c t i v e l y. See Note 16, Sales of Assets
and Dives titure s .
A pre-tax charge of $132 million ($87 million after tax) for
asset write-downs and employee severance in the Office Imaging
division due to volume reductions from Danka Business Systems
PLC (Danka). See Note 16, Sales of Assets and Divestiture s .
A pre-tax charge of $45 million ($30 million after tax), pri-
marily for in-process re s e a rch and development (R&D), associ-
ated with the acquisition of the medical imaging business of
Imation Corp. (the Imation charge). See Note 15, Acquisitions
and Joint Ve n t u re s .
Excluding the above items, and pre-tax litigation charges of
$35 million ($23 million after tax) related primarily to Health
Imaging, net earnings were $1,429 million. Basic earnings per
s h a re were $4.42 and diluted earnings per share were $4.37.
M a n a g e m e n t ’s Discussion and Analysis
of Financial C ondition and Results of Operations
S u m m a ry (in millions, except per share data) 2 0 0 0 C h a n g e 1 9 9 9 C h a n g e 1 9 9 8
S a l e s $1 3 , 9 9 4 – 1 % $1 4 , 0 8 9 + 5 % $ 1 3 , 4 0 6
E a rnings from operations 2 , 2 1 4 + 1 1 % 1 , 9 9 0 + 5 % 1 , 8 8 8
Net earn i n g s 1 , 4 0 7 + 1 % 1 , 3 9 2 – 1 , 3 9 0
Basic earnings per share 4 . 6 2 + 5 % 4 . 3 8 + 2 % 4 . 3 0
Diluted earnings per share 4 . 5 9 + 6 % 4 . 3 3 + 2 % 4 . 2 4


