Kodak 2000 Annual Report Download - page 40
Download and view the complete annual report
Please find page 40 of the 2000 Kodak annual report below. You can navigate through the pages in the report by either clicking on the pages listed below, or by using the keyword search tool below to find specific information within the annual report.-
 1
1 -
2
-
3
-
4
-
5
-
6
-
7
-
8
-
9
-
10
-
11
-
12
-
13
-
14
-
15
-
16
-
17
-
18
-
19
-
20
-
21
-
22
-
23
-
24
-
25
-
26
-
27
-
28
-
29
-
 30
30 -
 31
31 -
 32
32 -
 33
33 -
 34
34 -
 35
35 -
 36
36 -
 37
37 -
 38
38 -
 39
39 -
 40
40 -
 41
41 -
 42
42 -
 43
43 -
 44
44 -
 45
45 -
 46
46 -
 47
47 -
 48
48 -
 49
49 -
 50
50 -
51
-
52
-
53
-
54
-
55
-
56
-
57
-
58
-
59
-
60
-
61
-
62
-
63
-
64
-
65
-
66
-
67
-
68
-
69
-
70
-
71
-
72
-
73
-
74
-
75
-
76
-
77
-
78
-
79
-
80
-
81
-
82
-
83
-
84
-
85
-
86
-
87
-
88
-
89
-
90
-
91
-
92
-
93
-
94
-
95
-
96
-
97
-
98
-
99
-
100
-
101
-
102
-
103
-
104
-
105
-
106
-
107
-
108
-
109
-
110
 |
 |

its e-commerce strategies, and to complete information systems
upgrades; the successful completion of various portfolio actions;
the ability of the Company to reduce inventories, improve re c e i v -
ables perf o rmance, and reduce capital expenditures; the inhere n t
u n p redictability of currency fluctuations and raw material costs;
competitive actions, including pricing; the ability to reduce spend-
ing and realize operating efficiencies, including a significant
reduction in SKU’s; the ability to achieve planned impro v e m e n t s
in Kodak Professional; the nature and pace of technology substi-
tution; the ability of the Company to develop its business in
e m e rging markets like China and India; general economic and
business conditions, including the timing of a business upturn ;
and other factors disclosed previously and from time to time in the
C o m p a n y ’s filings with the Securities and Exchange Commission.
Any forw a rd-looking statements in this re p o rt should be
evaluated in light of these important risk factors.
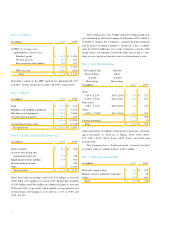
Market Price Data
2 0 0 0 1 9 9 9
Price per share : H i g h L o w H i g h L o w
1st Qtr. $6 7 . 5 0 $ 5 3 . 3 1 $ 8 0 . 3 8 $ 6 2 . 3 1
2nd Qtr. 6 3 . 6 3 5 3 . 1 9 7 9 . 8 1 6 0 . 8 1
3 rd Qtr. 6 5 . 6 9 3 9 . 7 5 7 8 . 2 5 6 8 . 2 5
4th Qtr. 4 8 . 5 0 3 5 . 3 1 7 7 . 5 0 5 6 . 6 3
S u m m a ry of Operating Data
A summary of operating data for 2000 and for the four years prior
is shown on page 64.
Quantitative and Qualitative Disclosures about Market Risk
The Company, as a result of its global operating and financing
activities, is exposed to changes in foreign currency exchange
rates, commodity prices, and interest rates, which may adversely
a f fect its results of operations and financial position. In seeking
to minimize the risks and/or costs associated with such activi-
ties, the Company may enter into derivative contracts. See also
Note 9, Financial Instru m e n t s .
On January 1, 2000, the Company adopted Financial
Accounting Standards Board (FAS B) Statement of Financial
Accounting Standards (SFAS) No. 133, “Accounting for Deriva-
tive Instruments and Hedging Activities.” This Statement re q u i re s
that an entity recognize all derivatives as either assets or liabilities
and measure those instruments at fair value. If certain conditions
a re met, a derivative may be designated as a hedge. The account-
ing for changes in the fair value of a derivative depends on the
intended use of the derivative and the resulting designation.
The transition adjustment was a pre-tax loss of $1 million
($1 million after tax) re c o rded in other income (charges) for
marking foreign exchange forw a rd contracts to fair value, and a
p re-tax gain of $3 million ($2 million after tax) re c o rded in other
c o m p rehensive income for marking silver forw a rd contracts to fair
value. These items were not displayed in s eparate captions as
cumulative effects of a change in accounting principle, due to
their immateriality. The fair value of the contracts is re p o rted in
other current assets or in current payables.
The Company has entered into foreign currency forw a rd
contracts that are designated as cash flow hedges of exchange
rate risk related to forecasted foreign currency denominated
i n t e rcompany sales. At December 31, 2000, the Company had
cash flow hedges for the Euro, the Canadian dollar, and the
Australian dollar, with maturity dates ranging from January 2001
to December 2001.
At December 31, 2000, the fair value of all open foreign cur-
rency forw a rd contracts was a pre-tax unrealized loss of $44 mil-
lion. Of this pre-tax loss, $42 million has been deferred as a part
of other compre hensive income while $2 million has been
c h a rge d to othe r income (c harge s ) on the C o mp any’s
Consolidated Statement of Earnings. Additionally, realized gains
of approximately $2 million (pre-tax), related to closed foreign cur-
rency contracts, have been deferred in other compre h e n s i v e
income. If all amounts deferred to other comprehensive income
w e re to be realized, approximately $39 million would be re c l a s s i -
fied into cost of goods sold over the next twelve months, based
on sales to third parties. During the year, a realized gain of $9 mil-
lion (pre-tax) was reclassified from other comprehensive income
to cost of goods s old. Hedge ineffectiveness was insignificant.
The Company does not apply hedge accounting to the for-
eign currency forw a rd contracts used to offset curre n c y - re l a t e d
changes in the fair value of foreign currency denominated assets
and liabilities. These contracts are marked to market thro u g h
e a rnings at the s ame time that the exposed assets and liabilities
a re re m e a s u red through earnings (both in other income). The
majority of the contracts held by the Company are denominated
in Euros, Australian dollars, Chinese renminbi, Canadian dollars,
and British pounds.
A sensitivity analysis indicates tha t if foreign curre n c y
exchange rates at December 31, 2000 and 1999 increased 10% ,
the Company would incur losses of $88 million and $87 million
on foreign currency forw a rd contracts outstanding at Decem-
ber 31, 2000 and 1999, re s p e c t i v e l y. Such losses would be sub-