Kodak 2000 Annual Report Download - page 63
Download and view the complete annual report
Please find page 63 of the 2000 Kodak annual report below. You can navigate through the pages in the report by either clicking on the pages listed below, or by using the keyword search tool below to find specific information within the annual report.-
 1
1 -
2
-
3
-
4
-
5
-
6
-
7
-
8
-
9
-
10
-
11
-
12
-
13
-
14
-
15
-
16
-
17
-
18
-
19
-
20
-
21
-
22
-
23
-
24
-
25
-
26
-
27
-
28
-
29
-
30
-
31
-
32
-
33
-
34
-
35
-
36
-
37
-
38
-
39
-
40
-
41
-
42
-
43
-
44
-
45
-
46
-
47
-
48
-
49
-
50
-
51
-
52
-
 53
53 -
 54
54 -
 55
55 -
 56
56 -
 57
57 -
 58
58 -
 59
59 -
 60
60 -
 61
61 -
 62
62 -
 63
63 -
 64
64 -
 65
65 -
 66
66 -
 67
67 -
 68
68 -
 69
69 -
 70
70 -
 71
71 -
 72
72 -
 73
73 -
74
-
75
-
76
-
77
-
78
-
79
-
80
-
81
-
82
-
83
-
84
-
85
-
86
-
87
-
88
-
89
-
90
-
91
-
92
-
93
-
94
-
95
-
96
-
97
-
98
-
99
-
100
-
101
-
102
-
103
-
104
-
105
-
106
-
107
-
108
-
109
-
110
 |
 |

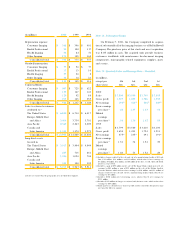
(in millions) 2 0 0 0 1 9 9 9 1 9 9 8
Operating net as sets:
Consumer Imaging $5 , 1 8 8 $5 , 0 0 5 $ 4 , 8 5 6
Kodak Pro f e s s i o n a l 1 , 5 3 1 1 , 6 3 6 1 , 5 9 1
Health Imaging 1 , 4 8 2 1 , 2 2 9 1 , 1 3 5
Other Imaging 1 , 3 4 3 1 , 0 7 4 1 , 1 7 3
Total of segments 9 , 5 4 4 8 , 9 4 4 8 , 7 5 5
LIFO inventory re s e rv e ( 4 4 9 ) ( 4 6 5 ) ( 4 9 1 )
Cash and marketable
s e c u r i t i e s 2 5 1 3 9 3 5 0 0
Dividends payable ( 1 2 8 ) ( 1 3 9 ) ( 1 4 2 )
Net deferred income tax
(liabilities) and assets ( 4 ) 1 9 1 4 5 7
N o n c u rrent other
postemployment
l i a b i l i t i e s ( 2 , 2 0 9 ) ( 2 , 2 8 9 ) ( 2 , 4 5 5 )
Other corporate
net assets ( 2 0 5 ) ( 6 2 4 ) ( 6 1 4 )
Consolidated
net assets( 1 ) $6 , 8 0 0( )$6 , 0 1 1 $ 6 , 0 1 0
D e p reciation expense:
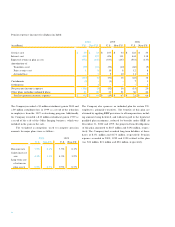
Segment financial information is shown below.
(in millions) 2 0 0 0 1 9 9 9 1 9 9 8
S a l e s :
Consumer Imaging $7 , 4 0 6 $7 , 4 1 1 $ 7 , 1 6 4
Kodak Pro f e s s i o n a l 1 , 7 0 6 1 , 9 1 0 1 , 8 4 0
Health Imaging 2 , 1 8 5 2 , 1 2 0 1 , 5 2 6
Other Imaging 2 , 6 9 7 2 , 6 4 8 2 , 8 7 6
Consolidated total $1 3 , 9 9 4 $1 4 , 0 8 9 $ 1 3 , 4 0 6
E a rnings from operations:
Consumer Imaging $1 , 1 7 9 $1 , 2 9 9 $ 1 , 0 8 0
Kodak Pro f e s s i o n a l 2 6 1 3 7 4 3 3 0
Health Imaging 5 0 3 4 7 0 3 2 1
Other Imaging 2 2 7 1 9 7 1 5 7
Total of segments 2 , 1 7 0 2 , 3 4 0 1 , 8 8 8
R e s t ructuring (charg e s )
c re d i t s 4 4 ( 3 5 0 ) –
Consolidated total $2 , 2 1 4 $1 , 9 9 0 $ 1 , 8 8 8
Net earn i n g s :
Consumer Imaging $8 6 0 $9 0 0 $ 7 8 5
Kodak Pro f e s s i o n a l 1 1 1 2 6 5 2 3 7
Health Imaging 3 4 6 3 1 5 2 0 5
Other Imaging 1 6 1 2 2 2 1 6 2
Total of segments 1 , 4 7 8 1 , 7 0 2 1 , 3 8 9
R e s t ructuring (charg e s )
c re d i t s 4 4 ( 3 5 0 ) –
Gain on sale of
N a n o S y s t e m s ––8 7
I n t e rest expense ( 1 7 8 ) ( 1 4 2 ) ( 1 1 0 )
Other corporate items 2 6 2 2 2 7
Income tax effects on
above items and
taxes not allocated
to segments 3 7 1 6 0 ( 3 )
Consolidated total $1 , 4 0 7 $1 , 3 9 2 $ 1 , 3 9 0
62
(in millions) 2 0 0 0 1 9 9 9 1 9 9 8
Total assets $1 4 , 2 1 2 $1 4 , 3 7 0 $ 1 4 , 7 3 3
Total liabilities 1 0 , 7 8 4 1 0 , 4 5 8 1 0 , 7 4 5
Less: Short - t e rm
b o rro w i n g s ( 2 , 2 0 6 ) ( 1 , 1 6 3 ) ( 1 , 5 1 8 )
Less: Long-term
b o rro w i n g s ( 1 , 1 6 6 ) ( 9 3 6 ) ( 5 0 4 )
N o n - i n t e rest-bearing
l i a b i l i t i e s 7 , 4 1 2 8 , 3 5 9 8 , 7 2 3
Consolidated net assets $6 , 8 0 0 $6 , 0 1 1 $ 6 , 0 1 0
( 1 ) Consolidated net assets are derived from the Consolidated Statement of Financial
Position, as follows: