Kodak 2000 Annual Report Download - page 37
Download and view the complete annual report
Please find page 37 of the 2000 Kodak annual report below. You can navigate through the pages in the report by either clicking on the pages listed below, or by using the keyword search tool below to find specific information within the annual report.-
 1
1 -
2
-
3
-
4
-
5
-
6
-
7
-
8
-
9
-
10
-
11
-
12
-
13
-
14
-
15
-
16
-
17
-
18
-
19
-
20
-
21
-
22
-
23
-
24
-
25
-
26
-
 27
27 -
 28
28 -
 29
29 -
 30
30 -
 31
31 -
 32
32 -
 33
33 -
 34
34 -
 35
35 -
 36
36 -
 37
37 -
 38
38 -
 39
39 -
 40
40 -
 41
41 -
 42
42 -
 43
43 -
 44
44 -
 45
45 -
 46
46 -
 47
47 -
48
-
49
-
50
-
51
-
52
-
53
-
54
-
55
-
56
-
57
-
58
-
59
-
60
-
61
-
62
-
63
-
64
-
65
-
66
-
67
-
68
-
69
-
70
-
71
-
72
-
73
-
74
-
75
-
76
-
77
-
78
-
79
-
80
-
81
-
82
-
83
-
84
-
85
-
86
-
87
-
88
-
89
-
90
-
91
-
92
-
93
-
94
-
95
-
96
-
97
-
98
-
99
-
100
-
101
-
102
-
103
-
104
-
105
-
106
-
107
-
108
-
109
-
110
 |
 |
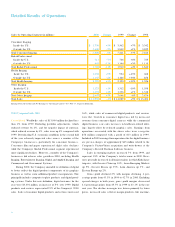
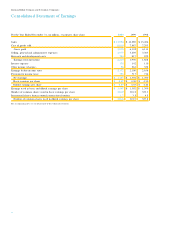
E a rnings from operations increased 20% in 1999, as higher
sales volumes, cost reductions and manufacturing pro d u c t i v i t y
m o re than offset lower effective selling prices and the unfavorable
e f fects of currency rate changes. Net earnings were $900 million,
an increase of 15% from the prior year, which included a $44 mil-
lion after-tax gain related to the sale of a portion of the Company’s
investment in Gretag. Excluding the 1998 Gretag gain, net earn-
ings increased 21% , as a result of increases in earnings fro m
o p e r a t i o n s .
Kodak Pro f e s s i o n a l Kodak Professional segment sales incre a s e d
4% in 1999. Adjusting for the contribution of the Japan graphics
business to the KPG joint venture, sales increased 8% , as higher
volumes more than offset lower effective selling prices. Sales
inside the U.S. increased 6% , as higher volumes more than off-
se t lowe r effective se lling prices . Sales outside the U.S.
i n c reased 3% , as higher volumes more than offset decre a s e s
f rom portfolio changes.
Worldwide Graphics film sales increased 9% in 1999 on the
s t rength of a 25% volume increase which more than offset lower
graphics film prices. Worldwide Portrait/Social sales incre a s e d
10%, as higher volumes and the favorable effects of exchange
w e re partially offset by lower effective selling prices. S ales inside
the U.S. increased 10%, due to higher volumes and higher eff e c-
tive selling prices. Sales outside the U.S. increased 9% , as vol-
ume increases and the favorable effects of exchange were
p a rtially offset by lower effective selling prices.
SG &A expenses for the segment decreased 7% , fro m
20.3% of sales in 1998 to 18.1% in 1999. Excluding advert i s i n g
expenses, SG&A expenses decreased 7% , from 17.7% of sales
in 1998 to 15.9% in 1999. R&D expenses decreased 23% , fro m
9.9% of sales in 1998 to 7.4% in 1999. The decrease in R&D
reflects the formation of the NexPress joint venture, whose R & D
investments were reclassified to other income (charges) during
1 9 9 9 .
E a rnings from operations increased 13% , or 20% excluding
the pre-tax charge of $20 million for CalComp (discussed pre-
viously), as higher sales volumes, manufacturing pro d u c t i v i t y,
and cost reductions in SG&A and R&D more than offset lower
e ffective selling prices. Net earnings increased 12% , primarily
reflecting strong contributions from earnings from operations.
Health Imaging Sales of the Health Imaging segment incre a s e d
39% in 1999, primarily due to the acquisition of Imation’s med-
ical imaging business. Excluding the effect of the acquisition,
sales increased 2%, as higher volumes more than offset lower
e f fective selling prices. Sales inside the U.S . increased 43%, due
primarily to the acquisition and higher volumes, offset by lower
e f fective selling prices. Sales outside the U.S. increased 36% ,
due to the acquisition and higher volumes, partly offset by lower
e f fective selling prices.
Worldwide analog film sales increased 19% over 1998, as
higher volumes more than offset lower effective selling prices.
Analog film sales inside the U.S. increased 9% , as higher vol-
umes more than offset lower effective selling prices. Outside the
U.S., analog film s ales increased 25% , as higher volumes more
than offset lower effective selling prices. Overall, significant vol-
ume growth worldwide is primarily attributable to the acquisition
of Imation’s medical imaging business.
Sales of digital products (including digital print film, laser
printers and digital media) also benefited from the Imation acqui-
sition, increasing 98% in 1999.
SG&A expenses increased 34% over 1998, due primarily
to the acquisition of Imation’s medical imaging business, but
d e c reased as a percentage of sales from 20.7% in 1998 to
20.0% in 1999. Excluding advertising expenses, SG&A expenses
i n c reased 34% , but decreased from 19.7% of sales in 1998
to 19.1% in 1999. Excluding the 1998 Imation charge, R&D
expenses increased 21% , but decreased from 6.9% of sales in
1998 to 6.0% in 1999.
E a rnings from operations increased 46% , or 29% excluding
f rom 1998 the pre-tax Imation charge of $45 million, as higher unit
sales volumes, manufacturing pro d u c t i v i t y, and cost reductions in
SG&A and R&D more than offset 1999’s lower effective selling
prices. Net earnings increas ed 54% , or 27% excluding fro m
1998 the charges for Imation and litigation, as a result of the
i n c rease in earnings from operations.
Other Imaging Sales in the Other Imaging segment decre a s e d
8% in 1999, as higher unit volumes were more than offset by
p o rtfolio changes (primarily the sale of the Office Imaging busi-
ness) and lower effective selling prices. Excluding the impact of
p o rtfolio adjustments, segment sales increased 5% . Sales of
digital cameras and C D media increased significantly, while
sales of motion picture films decreased due to softness in the
motion picture industry. Sales inside the U.S. decreased 16% , as
d e c reases from portfolio changes more than offset higher vol-
umes. Sales outside the U.S. increased 1% , as higher volumes
m o re than offset lower effective selling prices.
Worldwide digital camera sales increased 97% , as s ignifi-
cantly higher volumes were only slightly offset by lower eff e c t i v e
selling prices. Digital camera sales inside the U.S. incre a s e d
106% , due to higher volumes. Outside the U.S., sales incre a s e d
36