Kodak 2000 Annual Report Download - page 33
Download and view the complete annual report
Please find page 33 of the 2000 Kodak annual report below. You can navigate through the pages in the report by either clicking on the pages listed below, or by using the keyword search tool below to find specific information within the annual report.-
 1
1 -
2
-
3
-
4
-
5
-
6
-
7
-
8
-
9
-
10
-
11
-
12
-
13
-
14
-
15
-
16
-
17
-
18
-
19
-
20
-
21
-
22
-
 23
23 -
 24
24 -
 25
25 -
 26
26 -
 27
27 -
 28
28 -
 29
29 -
 30
30 -
 31
31 -
 32
32 -
 33
33 -
 34
34 -
 35
35 -
 36
36 -
 37
37 -
 38
38 -
 39
39 -
 40
40 -
 41
41 -
 42
42 -
 43
43 -
44
-
45
-
46
-
47
-
48
-
49
-
50
-
51
-
52
-
53
-
54
-
55
-
56
-
57
-
58
-
59
-
60
-
61
-
62
-
63
-
64
-
65
-
66
-
67
-
68
-
69
-
70
-
71
-
72
-
73
-
74
-
75
-
76
-
77
-
78
-
79
-
80
-
81
-
82
-
83
-
84
-
85
-
86
-
87
-
88
-
89
-
90
-
91
-
92
-
93
-
94
-
95
-
96
-
97
-
98
-
99
-
100
-
101
-
102
-
103
-
104
-
105
-
106
-
107
-
108
-
109
-
110
 |
 |

2000 Compared with 1999
C o n s o l i d a t e d Worldwide sales of $13,994 million declined less
than 1% from 1999. Excluding portfolio adjus tments, which
reduced revenue by 2% , and the negative impact of curre n c y,
which reduced revenue by 3% , sales were up 4% compared with
1999. Deteriorating U.S. economic conditions in the second half
of the year adversely impacted sales across a number of the
C o m p a n y ’s businesses, particularly the consumer bus iness.
C ons umer film and paper experienced slight sales declines
while the Company’s Kodak Professional segment experienced
m o re significant declines. However, a number of the Company’s
businesses did achieve sales growth in 2000, including Health
Imaging, Entertainment Imaging, Digital and Applied Imaging and
C o m m e rcial and Government Systems.
During 2000, the Company amended its definition of digital
to better reflect the digital product components of its graphics
business as well as some additional product reassignments. This
principally includes computer to plate products and digital pro o f-
ing systems. Under this new definition, digital revenues for the
year were $3,001 million, an increase of 5% over 1999. Digital
p roducts and services re p resented 21% of the Company’s 2000
sales. Sales of consumer digital products and services incre a s e d
16% , while s ales of commercial digital products and serv i c e s
w e re flat. Growth in consumer digital was led by increased
revenues from consumer digital cameras while the commerc i a l
digital business saw sales increases in healthcare - related off e r-
ings largely offset by reduced graphics sales. Earnings from
operations associated with the above sales were a negative
$58 million compared with a profit of $13 million in 1999.
Included in 2000 earnings from operations for the digital business
a re pre-tax charges of approximately $45 million related to the
C o m p a n y ’s Picture Vision acquisition and write-downs at the
C o m p a n y ’s divested Eastman Software business.
Sales in emerging markets increased 7% from 1999, and
re p resent 18% of the Company’s total revenue in 2000. Reve-
nues generally increased in all major regions in which Kodak par-
ticipates, with Greater China up 10%, Asian Emerging Markets
up 9% , Greater Russia up 39% , Latin America up 3% , and
E a s t e rn Europe up 2%.
G ross profit declined 2% with margins declining .6 per-
centage points from 43.3% in 1999 to 42.7% in 2000. Excluding
special charges in both years, gross profit margins decre a s e d
2.6 percentage points from 45.7% in 1999 to 43.1% in the cur-
rent year. The decline in margin was driven primarily by lower
prices, increased sales of lower margin products, like one-time-
32
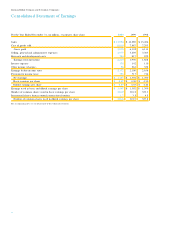
Detailed Results of Operations
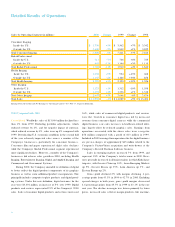
Sales by Operating Segment (in millions) 2 0 0 0 C h a n g e 1 9 9 9 C h a n g e 1 9 9 8
Consumer Imaging
Inside the U.S. $3 , 7 3 8 + 5 % $3 , 5 6 2 + 7 % $ 3 , 3 4 2
Outside the U.S. 3 , 6 6 8 – 5 % 3 , 8 4 9 + 1 % 3 , 8 2 2
Total Consumer Imaging 7 , 4 0 6 0 % 7 , 4 1 1 + 3 % 7 , 1 6 4
Kodak Pro f e s s i o n a l
Inside the U.S. 7 1 1 – 7 % 7 6 6 + 6 % 7 2 5
Outside the U.S. 9 9 5 – 1 3 % 1 , 1 4 4 + 3 % 1 , 1 1 5
Total Kodak Pro f e s s i o n a l 1 , 7 0 6 – 1 1 % 1 , 9 1 0 + 4 % 1 , 8 4 0
Health Imaging
Inside the U.S. 1 , 0 3 8 + 9 % 9 5 4 + 4 3 % 6 6 8
Outside the U.S. 1 , 1 4 7 – 2 % 1 , 1 6 6 + 3 6 % 8 5 8
Total Health Imaging 2 , 1 8 5 + 3 % 2 , 1 2 0 + 3 9 % 1 , 5 2 6
Other Imaging
Inside the U.S. 1 , 3 2 3 + 1 % 1 , 3 1 2 – 1 6 % 1 , 5 5 8
Outside the U.S. 1 , 3 7 4 + 3 % 1 , 3 3 6 + 1 % 1 , 3 1 8
Total Other Imaging 2 , 6 9 7 + 2 % 2 , 6 4 8 – 8 % 2 , 8 7 6
Total Sales $1 3 , 9 9 4 – 1 % $1 4 , 0 8 9 + 5 % $ 1 3 , 4 0 6
E a rnings From Operations and Net Earnings by Operating Segment—See Note 17, Segment Inform a t i o n .