Kodak 2000 Annual Report Download - page 64
Download and view the complete annual report
Please find page 64 of the 2000 Kodak annual report below. You can navigate through the pages in the report by either clicking on the pages listed below, or by using the keyword search tool below to find specific information within the annual report.-
 1
1 -
2
-
3
-
4
-
5
-
6
-
7
-
8
-
9
-
10
-
11
-
12
-
13
-
14
-
15
-
16
-
17
-
18
-
19
-
20
-
21
-
22
-
23
-
24
-
25
-
26
-
27
-
28
-
29
-
30
-
31
-
32
-
33
-
34
-
35
-
36
-
37
-
38
-
39
-
40
-
41
-
42
-
43
-
44
-
45
-
46
-
47
-
48
-
49
-
50
-
51
-
52
-
53
-
 54
54 -
 55
55 -
 56
56 -
 57
57 -
 58
58 -
 59
59 -
 60
60 -
 61
61 -
 62
62 -
 63
63 -
 64
64 -
 65
65 -
 66
66 -
 67
67 -
 68
68 -
 69
69 -
 70
70 -
 71
71 -
 72
72 -
 73
73 -
 74
74 -
75
-
76
-
77
-
78
-
79
-
80
-
81
-
82
-
83
-
84
-
85
-
86
-
87
-
88
-
89
-
90
-
91
-
92
-
93
-
94
-
95
-
96
-
97
-
98
-
99
-
100
-
101
-
102
-
103
-
104
-
105
-
106
-
107
-
108
-
109
-
110
 |
 |
Note 18: Subsequent Events
On Febru a ry 7, 2001, the Company completed its acquisi-
tion of substantially all of the imaging businesses of Bell & Howell
C o m p a n y. The purchase price of this stock and asset acquisition
was $135 million in cash. The acquired units provide business
customers worldwide with maintenance for document imaging
components, micro g r a p h i c - related equipment, supplies, part s
and serv i c e .
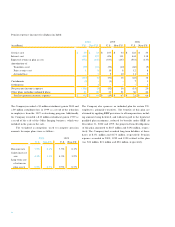
Note 19: Quarterly S ales and Earnings Data—Unaudited
(in millions,
except per 4th 3 rd 2nd 1st
s h a re data) Q t r. Q t r. Q t r. Q t r.
2 0 0 0
S a l e s $3 , 5 6 0 $ 3 , 5 9 0 $ 3 , 7 4 9 $ 3 , 0 9 5
G ross pro f i t 1 , 3 2 7 1 , 6 0 3 1 , 7 0 6 1 , 3 3 9
Net earn i n g s 1 9 4( 1 ) 4 1 8( 1 ) 5 0 6( 1 ) 2 8 9( 1 )
Basic earnings
per share( 5 ) . 6 6 1 . 3 7 1 . 6 3 . 9 3
Diluted
e a rnings
per share( 5 ) . 6 6 1 . 3 6 1 . 6 2 . 9 3
1 9 9 9
S a l e s $ 3 , 7 9 9 $ 3 , 5 8 0 $ 3 , 6 1 0 $ 3 , 1 0 0
G ross pro f i t 1 , 6 5 4 1 , 4 9 3 1 , 7 2 4 1 , 2 3 1
Net earn i n g s 4 7 5( 2 ) 2 3 5( 3 ) 4 9 1 1 9 1( 4 )
Basic earnings
per share( 5 ) 1 . 5 1 . 7 4 1 . 5 4 . 5 9
Diluted
e a rnings
per share( 5 ) 1 . 5 0 . 7 3 1 . 5 2 . 5 9
( 1 ) Includes charges related to the sale and exit of a manufacturing facility of $11 mil-
lion, $12 million, $18 million, and $9 million, which reduced net earnings by
$7 million, $8 million, $12 million, and $6 million in the first, second, third and fourt h
q u a rters, re s p e c t i v e l y.
( 2 )Includes a gain of $95 million on the sale of The Image Bank, which increased net
e a rnings by $63 million; a gain of $25 million on the sale of the Motion Analysis
Systems Division, which increased net earnings by $16 million; and $11 million of
c h a rges related to the sale and exit of a manufacturing facility, which reduced net
e a rnings by $7 million.
( 3 ) Includes $350 million of re s t ructuring costs, which reduc ed net earnings by
$231 million.
( 4 )Includes $103 million of charges associated with business exits, which reduced net
e a rnings by $68 million.
( 5 )Each quarter is calculated as a discrete period and the sum of the four quarters may
not equal the full year amount.
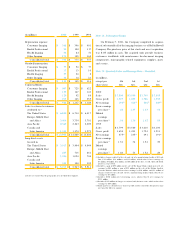
(in millions) 2 0 0 0 1 9 9 9 1 9 9 8
D e p reciation expens e:
Consumer Imaging $3 6 8 $3 9 6 $ 4 0 1
Kodak Pro f e s s i o n a l 9 9 1 0 0 1 1 7
Health Imaging 9 2 8 2 5 1
Other Imaging 1 7 9 1 9 5 1 6 8
Consolidated total $7 3 8 $7 7 3 $ 7 3 7
Goodwill amortization:
Consumer Imaging $7 7 $9 4 $ 7 7
Kodak Pro f e s s i o n a l 1 3 1 3 1 0
Health Imaging 2 7 2 4 8
Other Imaging 3 4 1 4 2 1
Consolidated total $1 5 1 $1 4 5 $ 1 1 6
Capital additions:
Consumer Imaging $5 0 7 $7 2 5 $ 6 2 2
Kodak Pro f e s s i o n a l 1 2 3 1 4 7 1 4 3
Health Imaging 1 2 0 9 2 8 8
Other Imaging 1 9 5 1 6 3 2 5 5
Consolidated total $9 4 5 $1 , 1 2 7 $ 1 , 1 0 8
Sales to external customers
attributed to:( 2 )
The United States $6 , 8 0 0 $6 , 7 1 4 $ 6 , 4 1 7
E u rope, Middle East
and Africa 3 , 4 6 4 3 , 7 3 4 3 , 7 0 1
Asia Pacific 2 , 3 4 9 2 , 2 6 7 2 , 0 0 9
Canada and
Latin America 1 , 3 8 1 1 , 3 7 4 1 , 2 7 9
Consolidated total $1 3 , 9 9 4 $1 4 , 0 8 9 $ 1 3 , 4 0 6
Long-lived assets
located in:
The United States $3 , 9 1 3 $3 , 9 0 4 $ 4 , 0 4 4
E u rope, Middle East
and Africa 6 4 7 7 1 5 8 6 1
Asia Pacific 1 , 0 5 6 1 , 0 2 4 7 0 4
Canada and
Latin America 3 0 3 3 0 4 3 0 5
Consolidated total $5 , 9 1 9 $5 , 9 4 7 $ 5 , 9 1 4
( 2 ) Sales are re p o rted in the geographic area in which they originate.