Hasbro 2006 Annual Report Download - page 84
Download and view the complete annual report
Please find page 84 of the 2006 Hasbro annual report below. You can navigate through the pages in the report by either clicking on the pages listed below, or by using the keyword search tool below to find specific information within the annual report.-
 1
1 -
2
-
3
-
4
-
5
-
6
-
7
-
8
-
9
-
10
-
11
-
12
-
13
-
14
-
15
-
16
-
17
-
18
-
19
-
20
-
21
-
22
-
23
-
24
-
25
-
26
-
27
-
28
-
29
-
30
-
31
-
32
-
33
-
34
-
35
-
36
-
37
-
38
-
39
-
40
-
41
-
42
-
43
-
44
-
45
-
46
-
47
-
48
-
49
-
50
-
51
-
52
-
53
-
54
-
55
-
56
-
57
-
58
-
59
-
60
-
61
-
62
-
63
-
64
-
65
-
66
-
67
-
68
-
69
-
70
-
71
-
72
-
73
-
 74
74 -
 75
75 -
 76
76 -
 77
77 -
 78
78 -
 79
79 -
 80
80 -
 81
81 -
 82
82 -
 83
83 -
 84
84 -
 85
85 -
 86
86 -
 87
87 -
 88
88 -
 89
89 -
 90
90 -
 91
91 -
 92
92 -
 93
93 -
 94
94 -
95
-
96
-
97
-
98
-
99
-
100
-
101
-
102
-
103
 |
 |

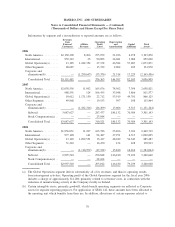
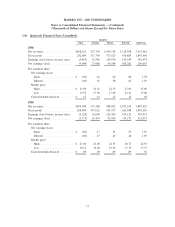
(16) Quarterly Financial Data (Unaudited)
First Second Third Fourth Full Year
Quarter
2006
Net revenues ................... $468,181 527,764 1,039,138 1,116,398 3,151,481
Gross profit ................... 282,089 317,395 577,627 670,485 1,847,596
Earnings (loss) before income taxes . . (5,453) 32,502 143,876 170,549 341,474
Net earnings (loss) .............. (4,899) 27,088 99,584 108,282 230,055
Per common share
Net earnings (loss)
Basic ..................... $ (.03) .16 .62 .68 1.38
Diluted ................... (.03) .07 .58 .62 1.29
Market price
High ..................... $ 21.90 21.27 22.75 27.69 27.69
Low ..................... 19.52 17.90 17.00 22.41 17.00
Cash dividends declared ........ $ .12 .12 .12 .12 .48
2005
Net revenues ................... $454,944 572,388 988,052 1,072,243 3,087,627
Gross profit ................... 288,969 347,622 543,277 621,488 1,801,356
Earnings (loss) before income taxes . . (3,225) 32,690 126,326 155,122 310,913
Net earnings (loss) .............. (3,713) 29,454 92,063 94,271 212,075
Per common share
Net earnings (loss)
Basic ..................... $ (.02) .17 .51 .53 1.19
Diluted ................... (.02) .13 .47 .48 1.09
Market price
High ..................... $ 21.50 21.00 22.35 20.75 22.35
Low ..................... 18.11 18.40 19.83 17.75 17.75
Cash dividends declared ........ $ .09 .09 .09 .09 .36
73
HASBRO, INC. AND SUBSIDIARIES
Notes to Consolidated Financial Statements — (Continued)
(Thousands of Dollars and Shares Except Per Share Data)