Hasbro 2006 Annual Report Download - page 37
Download and view the complete annual report
Please find page 37 of the 2006 Hasbro annual report below. You can navigate through the pages in the report by either clicking on the pages listed below, or by using the keyword search tool below to find specific information within the annual report.-
 1
1 -
2
-
3
-
4
-
5
-
6
-
7
-
8
-
9
-
10
-
11
-
12
-
13
-
14
-
15
-
16
-
17
-
18
-
19
-
20
-
21
-
22
-
23
-
24
-
25
-
26
-
 27
27 -
 28
28 -
 29
29 -
 30
30 -
 31
31 -
 32
32 -
 33
33 -
 34
34 -
 35
35 -
 36
36 -
 37
37 -
 38
38 -
 39
39 -
 40
40 -
 41
41 -
 42
42 -
 43
43 -
 44
44 -
 45
45 -
 46
46 -
 47
47 -
48
-
49
-
50
-
51
-
52
-
53
-
54
-
55
-
56
-
57
-
58
-
59
-
60
-
61
-
62
-
63
-
64
-
65
-
66
-
67
-
68
-
69
-
70
-
71
-
72
-
73
-
74
-
75
-
76
-
77
-
78
-
79
-
80
-
81
-
82
-
83
-
84
-
85
-
86
-
87
-
88
-
89
-
90
-
91
-
92
-
93
-
94
-
95
-
96
-
97
-
98
-
99
-
100
-
101
-
102
-
103
 |
 |

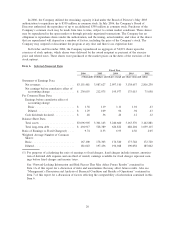
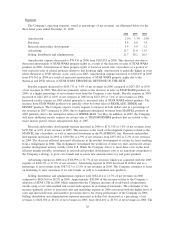
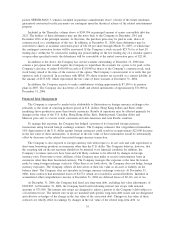
Expenses
The Company’s operating expenses, stated as percentages of net revenues, are illustrated below for the
three fiscal years ended December 31, 2006:
2006 2005 2004
Amortization ................................................. 2.5% 3.3% 2.4%
Royalties .................................................... 5.4 8.0 7.4
Research and product development ................................. 5.4 4.9 5.2
Advertising .................................................. 11.7 11.8 12.9
Selling, distribution and administration .............................. 21.7 20.2 20.5
Amortization expense decreased to $78,934 in 2006 from $102,035 in 2005. This decrease was due to
decreased amortization of STAR WARS property rights as a result of the decrease in sales of STAR WARS
products in 2006. Amortization of these property rights is based on actual sales of products as a portion of
total expected sales of related products related to this licensing right. Amortization is generally higher in years
where theatrical or DVD releases occur, such as in 2005. Amortization expense increased to $102,035 in 2005
from $70,562 in 2004 as a result of increased amortization of STAR WARS property rights due to the
theatrical and DVD releases of STAR WARS EPISODE III: REVENGE OF THE SITH.
Royalty expense decreased to $169,731 or 5.4% of net revenues in 2006 compared to $247,283 or 8.0%
of net revenues in 2005. This decrease primarily relates to the decrease in sales of STAR WARS products in
2006, as a higher percentage of net revenues were from the Company’s core brands. Royalty expense in 2005
increased to $247,283 or 8.0% of net revenues in 2005 from $223,193 or 7.4% of net revenues in 2004.
Increased royalty expense in 2005 related primarily to increased sales of STAR WARS related products. The
increase from STAR WARS products was partially offset by lower sales of BEYBLADE, SHREK and
DISNEY products. The Company expects royalty expense to increase in both dollars and as a percentage of
net revenues in 2007 compared to 2006, due to significant anticipated revenues from MARVEL products in
2007 primarily due to the anticipated release of SPIDER-MAN 3 in May. In addition, in 2007, the Company
will incur additional royalty expense on certain sales of TRANSFORMERS products that are related to the
major motion picture release anticipated in July of 2007.
Research and product development expense increased in 2006 to $171,358 or 5.4% of net revenues from
$150,586 or 4.9% of net revenues in 2005. This increase is the result of development expenses related to the
MARVEL line of products as well as increased investment in the PLAYSKOOL line. Research and product
development decreased in 2005 to $150,586 or 4.9% of net revenues from $157,162 or 5.2% of net revenues
in 2004. The decrease reflected increased efficiencies in the product development of certain toy lines resulting
from a realignment in 2004. This realignment streamlined the workforce of these toy lines and moved certain
product development activity outside of the U.S. While the Company strives to incur these costs in the most
efficient manner possible, investment in research and product development costs is an important component to
the Company’s strategy to grow core brands and to create new and innovative toy and game products.
Advertising expense in 2006 was $368,996 or 11.7% of net revenues which was consistent with the 2005
expense of $366,371 or 11.8% of net revenues. Advertising expense in 2005 decreased in dollars and as a
percentage of net revenues from $387,523 or 12.9% of net revenues in 2004. The Company continues to focus
on marketing to raise awareness of its core brands, as well as to introduce new products.
Selling, distribution and administration expenses were $682,214 or 21.7% of net revenues in 2006
compared to $624,560 or 20.2% in 2005. Approximately $20,000 of this increase relates to the Company’s
adoption of SFAS 123R in 2006 which required that the Company measure all stock-based compensation
awards using a fair value method and record such expense in its financial statements. The remainder of the
increase primarily relates to increased sales and marketing expense in 2006 associated with the higher level of
sales and increased bonus and incentive provisions due to the strong performance of the Company in 2006.
Selling, distribution and administration expenses increased in dollars but decreased as a percentage of net
revenues to $624,560 or 20.2% of net revenues in 2005, from $614,401 or 20.5% of net revenues in 2004. The
26