Hasbro 2006 Annual Report Download - page 81
Download and view the complete annual report
Please find page 81 of the 2006 Hasbro annual report below. You can navigate through the pages in the report by either clicking on the pages listed below, or by using the keyword search tool below to find specific information within the annual report.-
 1
1 -
2
-
3
-
4
-
5
-
6
-
7
-
8
-
9
-
10
-
11
-
12
-
13
-
14
-
15
-
16
-
17
-
18
-
19
-
20
-
21
-
22
-
23
-
24
-
25
-
26
-
27
-
28
-
29
-
30
-
31
-
32
-
33
-
34
-
35
-
36
-
37
-
38
-
39
-
40
-
41
-
42
-
43
-
44
-
45
-
46
-
47
-
48
-
49
-
50
-
51
-
52
-
53
-
54
-
55
-
56
-
57
-
58
-
59
-
60
-
61
-
62
-
63
-
64
-
65
-
66
-
67
-
68
-
69
-
70
-
 71
71 -
 72
72 -
 73
73 -
 74
74 -
 75
75 -
 76
76 -
 77
77 -
 78
78 -
 79
79 -
 80
80 -
 81
81 -
 82
82 -
 83
83 -
 84
84 -
 85
85 -
 86
86 -
 87
87 -
 88
88 -
 89
89 -
 90
90 -
 91
91 -
92
-
93
-
94
-
95
-
96
-
97
-
98
-
99
-
100
-
101
-
102
-
103
 |
 |

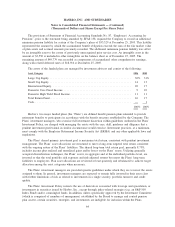
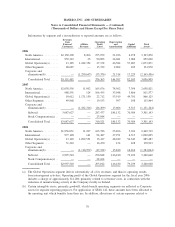
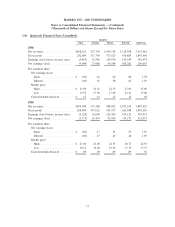
Information by segment and a reconciliation to reported amounts are as follows:
Revenues
from
External
Customers
Affiliate
Revenue
Operating
Profit
(Loss)
Depreciation
and
Amortization
Capital
Additions
Total
Assets
2006
North America .......... $2,130,290 8,266 275,959 51,926 4,278 3,193,870
International............ 959,319 23 90,893 24,681 3,004 859,690
Global Operations(a) ..... 13,185 1,242,354 27,158 46,584 57,487 1,073,871
Other Segments ......... 48,687 — 15,729 2,002 105 134,970
Corporate and
eliminations(b) ........ — (1,250,643) (33,376) 21,514 17,229 (2,165,496)
Consolidated Total ..... $3,151,481 — 376,363 146,707 82,103 3,096,905
2005
North America .......... $2,038,556 11,042 165,676 78,562 7,394 2,658,821
International............ 988,591 124 106,435 33,048 3,866 811,577
Global Operations(a) ..... 10,612 1,171,150 22,712 53,919 49,701 866,125
Other Segments ......... 49,868 — 19,153 997 108 115,864
Corporate and
eliminations(b) ........ — (1,182,316) (26,499) 13,606 9,515 (1,151,244)
Subtotal ............. 3,087,627 — 287,477 180,132 70,584 3,301,143
Stock Compensation(c) . . — — 23,044 — — —
Consolidated Total ..... $3,087,627 — 310,521 180,132 70,584 3,301,143
2004
North America .......... $1,956,031 11,247 163,786 53,266 3,941 2,469,719
International............ 977,128 161 94,487 27,971 4,313 1,090,605
Global Operations(a) ..... 13,129 1,099,551 13,437 48,949 56,343 885,487
Other Segments ......... 51,222 — 16,470 154 428 178,913
Corporate and
eliminations(b) ........ — (1,110,959) (17,332) 15,840 14,214 (1,384,064)
Subtotal ............. 2,997,510 — 270,848 146,180 79,239 3,240,660
Stock Compensation(c) . . — — 22,164 — — —
Consolidated Total ..... $2,997,510 — 293,012 146,180 79,239 3,240,660
(a) The Global Operations segment derives substantially all of its revenues, and thus its operating results,
from intersegment activities. Operating profit of the Global Operations segment for the fiscal year 2006
includes a charge of approximately $11,200, primarily related to severance costs, in connection with the
reduction of manufacturing activity at the Company facility in Ireland.
(b) Certain intangible assets, primarily goodwill, which benefit operating segments are reflected as Corporate
assets for segment reporting purposes. For application of SFAS 142, these amounts have been allocated to
the reporting unit which benefits from their use. In addition, allocations of certain expenses related to
70
HASBRO, INC. AND SUBSIDIARIES
Notes to Consolidated Financial Statements — (Continued)
(Thousands of Dollars and Shares Except Per Share Data)