Hasbro 2006 Annual Report Download - page 16
Download and view the complete annual report
Please find page 16 of the 2006 Hasbro annual report below. You can navigate through the pages in the report by either clicking on the pages listed below, or by using the keyword search tool below to find specific information within the annual report.-
 1
1 -
2
-
3
-
4
-
5
-
 6
6 -
 7
7 -
 8
8 -
 9
9 -
 10
10 -
 11
11 -
 12
12 -
 13
13 -
 14
14 -
 15
15 -
 16
16 -
 17
17 -
 18
18 -
 19
19 -
 20
20 -
 21
21 -
 22
22 -
 23
23 -
 24
24 -
 25
25 -
 26
26 -
27
-
28
-
29
-
30
-
31
-
32
-
33
-
34
-
35
-
36
-
37
-
38
-
39
-
40
-
41
-
42
-
43
-
44
-
45
-
46
-
47
-
48
-
49
-
50
-
51
-
52
-
53
-
54
-
55
-
56
-
57
-
58
-
59
-
60
-
61
-
62
-
63
-
64
-
65
-
66
-
67
-
68
-
69
-
70
-
71
-
72
-
73
-
74
-
75
-
76
-
77
-
78
-
79
-
80
-
81
-
82
-
83
-
84
-
85
-
86
-
87
-
88
-
89
-
90
-
91
-
92
-
93
-
94
-
95
-
96
-
97
-
98
-
99
-
100
-
101
-
102
-
103
 |
 |

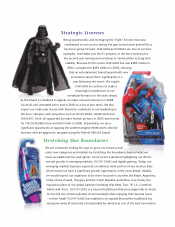
We also produce a number of toys under trademarks and copyrights utilizing the names or likenesses of
characters from movies, television shows and other entertainment media, for whose rights we compete with
other toy and game manufacturers. Licensing fees for these rights are generally paid as a royalty on our net
sales of the item. Licenses for the use of characters are generally exclusive for specific products or product
lines in specified territories. In many instances, advance royalties and minimum guarantees are required by
these license agreements. In 2006, 2005, and 2004, we incurred $169,731, $247,283, and $223,193,
respectively, of royalty expense. A portion of this expense relates to amounts paid in prior years as royalty
advances. Our royalty expenses in any given year vary depending upon the timing of movie releases and other
entertainment. In 2005, royalty expense increased due to the release of STAR WARS EPISODE III:
REVENGE OF THE SITH, and the corresponding increase of our sales of STAR WARS licensed products. In
2007, the Company has licensed products tied to anticipated MARVEL major motion picture releases,
including SPIDER-MAN 3 in May of 2007 as well as FANTASTIC FOUR: THE RISE OF THE SILVER
SURFER and GHOSTRIDER. We will also incur royalties on products based on the theatrical release of
TRANSFORMERS in July of 2007. As such, we expect higher royalty expense in 2007 then was incurred in
2006.
We have $116,792 of prepaid royalties, which are a component of prepaid expenses and other current
assets on our balance sheet. Included in other assets is $64,769 representing the long-term portion of royalty
advances already paid. As further detailed in Item 7, Management’s Discussion and Analysis of Financial
Condition and Results of Operations, based on contracts in effect at December 31, 2006, the Company may be
required to pay approximately $164,780 of minimum guaranteed royalties at various times from 2007 through
2011. Amounts paid and advances to be paid relate to anticipated revenues from licensed properties to be sold
in the years 2007 through 2018.
Marketing and Sales
Our products are sold nationally and internationally to a broad spectrum of customers, including
wholesalers, distributors, chain stores, discount stores, mail order houses, catalog stores, department stores and
other traditional retailers, large and small, as well as internet-based “e-tailers.” Our own sales forces account
for the majority of sales of our products. Remaining sales are generated by independent distributors who sell
our products, for the most part, in areas of the world where we do not otherwise maintain a direct presence.
Although we had more than 2,500 customers in the United States and Canada during 2006, including specialty
retailers carrying trading card games and toy-related products, there has been significant consolidation at the
retail level over the last several years in our industry, which we expect to continue. As a result, the majority of
our sales are to large chain stores, distributors and wholesalers. While the consolidation of customers provides
us with certain benefits, such as potentially more efficient product distribution and other decreased costs of
sales and distribution, this consolidation also creates additional risks to our business associated with a major
customer having financial difficulties or reducing its business with us. In addition, customer concentration may
decrease the prices we are able to obtain for some of our products and reduce the number of products we
would otherwise be able to bring to market. During 2006, sales to our three largest customers, Wal-Mart
Stores, Inc., Target Corporation and Toys ‘R Us, Inc., represented 24%, 13% and 11%, respectively, of
consolidated net revenues, and sales to our top five customers accounted for approximately 53% of our
consolidated net revenues. During 2006, 90% of the net revenues from our top 5 customers related to the
North American segment.
We advertise many of our toy and game products extensively on television. Generally our advertising
highlights selected items in our various product groups in a manner designed to promote the sale of not only
the selected item, but also other items we offer in those product groups as well. We introduce many of our
new products to major customers during the year prior to the year of introduction of such products for retail
sale. In addition, we showcase many of our new products at international toy fairs held early in the fiscal year
in Hong Kong, London, Nuremberg, and New York City.
In 2006 we spent $368,996 on advertising, promotion and marketing programs compared to $366,371 in
2005 and $387,523 in 2004.
5