Hasbro 2006 Annual Report Download - page 52
Download and view the complete annual report
Please find page 52 of the 2006 Hasbro annual report below. You can navigate through the pages in the report by either clicking on the pages listed below, or by using the keyword search tool below to find specific information within the annual report.-
 1
1 -
2
-
3
-
4
-
5
-
6
-
7
-
8
-
9
-
10
-
11
-
12
-
13
-
14
-
15
-
16
-
17
-
18
-
19
-
20
-
21
-
22
-
23
-
24
-
25
-
26
-
27
-
28
-
29
-
30
-
31
-
32
-
33
-
34
-
35
-
36
-
37
-
38
-
39
-
40
-
41
-
 42
42 -
 43
43 -
 44
44 -
 45
45 -
 46
46 -
 47
47 -
 48
48 -
 49
49 -
 50
50 -
 51
51 -
 52
52 -
 53
53 -
 54
54 -
 55
55 -
 56
56 -
 57
57 -
 58
58 -
 59
59 -
 60
60 -
 61
61 -
 62
62 -
63
-
64
-
65
-
66
-
67
-
68
-
69
-
70
-
71
-
72
-
73
-
74
-
75
-
76
-
77
-
78
-
79
-
80
-
81
-
82
-
83
-
84
-
85
-
86
-
87
-
88
-
89
-
90
-
91
-
92
-
93
-
94
-
95
-
96
-
97
-
98
-
99
-
100
-
101
-
102
-
103
 |
 |

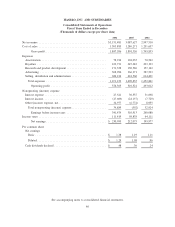
HASBRO, INC. AND SUBSIDIARIES
Consolidated Statements of Cash Flows
Fiscal Years Ended in December
(Thousands of dollars)
2006 2005 2004
Cash flows from operating activities
Net earnings . . . . . . . . . . . . . . . . . . . . . . . . . . . . . . . . . . . . . . . . . . . . . . . . . . . . . . $ 230,055 212,075 195,977
Adjustments to reconcile net earnings to net cash provided by operating activities:
Depreciation and amortization of plant and equipment . . . . . . . . . . . . . . . . . . . . . . . . 67,773 78,097 75,618
Other amortization . . . . . . . . . . . . . . . . . . . . . . . . . . . . . . . . . . . . . . . . . . . . . . . . 78,934 102,035 70,562
Loss on early extinguishment of debt . . . . . . . . . . . . . . . . . . . . . . . . . . . . . . . . . . . . — — 1,277
Loss on impairment of investment . . . . . . . . . . . . . . . . . . . . . . . . . . . . . . . . . . . . . . 2,629 — 8,988
Change in fair value of liabilities potentially settleable in common stock . . . . . . . . . . . . 31,770 (2,080) (12,710)
Deferred income taxes . . . . . . . . . . . . . . . . . . . . . . . . . . . . . . . . . . . . . . . . . . . . . . 24,967 (24,032) 34,624
Stock-based compensation . . . . . . . . . . . . . . . . . . . . . . . . . . . . . . . . . . . . . . . . . . . 22,832 74 138
Excess tax benefits from stock-based compensation . . . . . . . . . . . . . . . . . . . . . . . . . . (14,959) — —
Change in operating assets and liabilities (other than cash and cash equivalents):
(Increase) decrease in accounts receivable . . . . . . . . . . . . . . . . . . . . . . . . . . . . . . . . (10,708) 39,341 75,590
(Increase) decrease in inventories . . . . . . . . . . . . . . . . . . . . . . . . . . . . . . . . . . . . . . (17,623) 10,677 (15,838)
(Increase) decrease in prepaid expenses and other current assets. . . . . . . . . . . . . . . . . . (35,174) 74,531 29,423
Increase (decrease) in accounts payable and accrued liabilities . . . . . . . . . . . . . . . . . . . (20,680) 33,211 (89,735)
Other, including long-term advances . . . . . . . . . . . . . . . . . . . . . . . . . . . . . . . . . . . . (39,169) (27,305) (15,408)
Net cash provided by operating activities . . . . . . . . . . . . . . . . . . . . . . . . . . . . . . . 320,647 496,624 358,506
Cash flows from investing activities
Additions to property, plant and equipment . . . . . . . . . . . . . . . . . . . . . . . . . . . . . . . . . (82,103) (70,584) (79,239)
Investments and acquisitions, net of cash acquired. . . . . . . . . . . . . . . . . . . . . . . . . . . . . — (79,179) (9,824)
Proceeds from sale of property, plant and equipment . . . . . . . . . . . . . . . . . . . . . . . . . . . 1,197 33,083 4,309
Puchases of short-term investments . . . . . . . . . . . . . . . . . . . . . . . . . . . . . . . . . . . . . . . (941,120) — —
Proceeds from sales of short-term investments . . . . . . . . . . . . . . . . . . . . . . . . . . . . . . . 941,120 — —
Other . . . . . . . . . . . . . . . . . . . . . . . . . . . . . . . . . . . . . . . . . . . . . . . . . . . . . . . . . . . (2,698) (3,991) (213)
Net cash utilized by investing activities. . . . . . . . . . . . . . . . . . . . . . . . . . . . . . . . . (83,604) (120,671) (84,967)
Cash flows from financing activities
Repurchases and repayments of borrowings with original maturities of more than three
months . . . . . . . . . . . . . . . . . . . . . . . . . . . . . . . . . . . . . . . . . . . . . . . . . . . . . . . . (32,743) (93,303) (57,974)
Net repayments of other short-term borrowings. . . . . . . . . . . . . . . . . . . . . . . . . . . . . . . (3,726) (3,685) (6,598)
Purchase of common stock . . . . . . . . . . . . . . . . . . . . . . . . . . . . . . . . . . . . . . . . . . . . (456,744) (48,030) —
Stock option transactions. . . . . . . . . . . . . . . . . . . . . . . . . . . . . . . . . . . . . . . . . . . . . . 86,257 45,278 25,836
Excess tax benefits from stock-based compensation . . . . . . . . . . . . . . . . . . . . . . . . . . . . 14,959 — —
Dividends paid . . . . . . . . . . . . . . . . . . . . . . . . . . . . . . . . . . . . . . . . . . . . . . . . . . . . (75,282) (58,901) (37,088)
Net cash utilized by financing activities . . . . . . . . . . . . . . . . . . . . . . . . . . . . . . . . (467,279) (158,641) (75,824)
Effect of exchange rate changes on cash . . . . . . . . . . . . . . . . . . . . . . . . . . . . . . . . . . . . . 3,368 (46) 6,540
(Decrease) increase in cash and cash equivalents . . . . . . . . . . . . . . . . . . . . . . . . . . (226,868) 217,266 204,255
Cash and cash equivalents at beginning of year . . . . . . . . . . . . . . . . . . . . . . . . . . . . . . . . 942,268 725,002 520,747
Cash and cash equivalents at end of year. . . . . . . . . . . . . . . . . . . . . . . . . . . . . . . . . . . . . $ 715,400 942,268 725,002
Supplemental information
Interest paid . . . . . . . . . . . . . . . . . . . . . . . . . . . . . . . . . . . . . . . . . . . . . . . . . . . $ 26,228 33,265 35,781
Income taxes paid . . . . . . . . . . . . . . . . . . . . . . . . . . . . . . . . . . . . . . . . . . . . . . . $ 84,901 32,962 40,647
See accompanying notes to consolidated financial statements.
41