Hasbro 2006 Annual Report Download - page 10
Download and view the complete annual report
Please find page 10 of the 2006 Hasbro annual report below. You can navigate through the pages in the report by either clicking on the pages listed below, or by using the keyword search tool below to find specific information within the annual report.-
 1
1 -
 2
2 -
 3
3 -
 4
4 -
 5
5 -
 6
6 -
 7
7 -
 8
8 -
 9
9 -
 10
10 -
 11
11 -
 12
12 -
 13
13 -
 14
14 -
 15
15 -
 16
16 -
 17
17 -
 18
18 -
 19
19 -
 20
20 -
 21
21 -
22
-
23
-
24
-
25
-
26
-
27
-
28
-
29
-
30
-
31
-
32
-
33
-
34
-
35
-
36
-
37
-
38
-
39
-
40
-
41
-
42
-
43
-
44
-
45
-
46
-
47
-
48
-
49
-
50
-
51
-
52
-
53
-
54
-
55
-
56
-
57
-
58
-
59
-
60
-
61
-
62
-
63
-
64
-
65
-
66
-
67
-
68
-
69
-
70
-
71
-
72
-
73
-
74
-
75
-
76
-
77
-
78
-
79
-
80
-
81
-
82
-
83
-
84
-
85
-
86
-
87
-
88
-
89
-
90
-
91
-
92
-
93
-
94
-
95
-
96
-
97
-
98
-
99
-
100
-
101
-
102
-
103
 |
 |

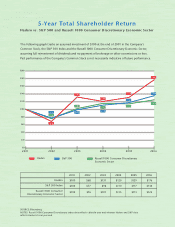
Hasbro S&P 500 Russell 1000 Consumer Discretionary
Economic Sector
Russell 1000 Consumer
Discretionary Economic Sector
Hasbro
S&P 500 Index
2002
2001 2003 2004 2005 2006
$100
$100
$100
$68
$77
$76
$131
$98
$101
$120
$110
$115
$129
$117
$113
$176
$134
$123
$200
$180
$160
$140
$120
$100
$80
$60
$40
$20
$0
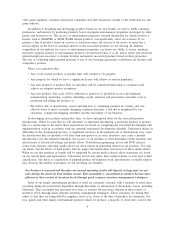
5-Year Total Shareholder Return
Hasbro vs. S&P 500 and Russell 1000 Consumer Discretionary Economic Sector
2001 2002 2003 2004 2005 2006
SOURCE: Bloomberg
NOTES: Russell 1000 Consumer Discretionary index data refl ects calendar year end whereas Hasbro and S&P data
refl ects Hasbro's fi scal year end.
The following graph tracks an assumed investment of $100 at the end of 2001 in the Company's
Common Stock, the S&P 500 Index and the Russell 1000 Consumer Discretionary Economic Sector,
assuming full reinvestment of dividends and no payment of brokerage or other commissions or fees.
Past performance of the Company's Common Stock is not necessarily indicative of future performance.
$77
$76
$68
$131
$101
$98
$120
$115
$110
$129
$117
$113
$123
$134
$176