Hasbro 2006 Annual Report Download - page 31
Download and view the complete annual report
Please find page 31 of the 2006 Hasbro annual report below. You can navigate through the pages in the report by either clicking on the pages listed below, or by using the keyword search tool below to find specific information within the annual report.-
 1
1 -
2
-
3
-
4
-
5
-
6
-
7
-
8
-
9
-
10
-
11
-
12
-
13
-
14
-
15
-
16
-
17
-
18
-
19
-
20
-
 21
21 -
 22
22 -
 23
23 -
 24
24 -
 25
25 -
 26
26 -
 27
27 -
 28
28 -
 29
29 -
 30
30 -
 31
31 -
 32
32 -
 33
33 -
 34
34 -
 35
35 -
 36
36 -
 37
37 -
 38
38 -
 39
39 -
 40
40 -
 41
41 -
42
-
43
-
44
-
45
-
46
-
47
-
48
-
49
-
50
-
51
-
52
-
53
-
54
-
55
-
56
-
57
-
58
-
59
-
60
-
61
-
62
-
63
-
64
-
65
-
66
-
67
-
68
-
69
-
70
-
71
-
72
-
73
-
74
-
75
-
76
-
77
-
78
-
79
-
80
-
81
-
82
-
83
-
84
-
85
-
86
-
87
-
88
-
89
-
90
-
91
-
92
-
93
-
94
-
95
-
96
-
97
-
98
-
99
-
100
-
101
-
102
-
103
 |
 |

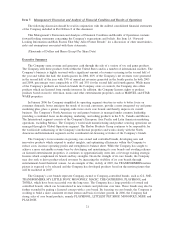
In 2006, the Company utilized the remaining capacity it had under the Board of Director’s May 2005
authorization to repurchase up to $350 million in common stock. In July 2006, the Company’s Board of
Directors authorized the repurchase of up to an additional $350 million in common stock. Purchases of the
Company’s common stock may be made from time to time, subject to certain market conditions. These shares
may be repurchased in the open market or through privately negotiated transactions. The Company has no
obligation to repurchase shares under the authorization, and the timing, actual number, and value of the shares
that are repurchased will depend on a number of factors, including the price of the Company’s stock. The
Company may suspend or discontinue the program at any time and there is no expiration date.
In October and November 2006, the Company repurchased an aggregate of 54,891 shares upon the
exercises of stock options, which shares were delivered by the award recipient as payment of the exercise
price and related taxes. These shares were purchased at the market prices on the dates of the exercises of the
stock options.
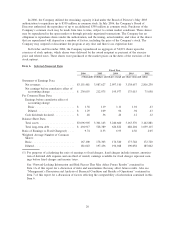
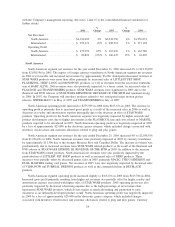
Item 6. Selected Financial Data
2006 2005 2004 2003 2002
Fiscal Year
(Thousands of dollars and shares except per share data and ratios)
Statement of Earnings Data:
Net revenues ..................... $3,151,481 3,087,627 2,997,510 3,138,657 2,816,230
Net earnings before cumulative effect of
accounting change ............... $ 230,055 212,075 195,977 175,015 75,058
Per Common Share Data:
Earnings before cumulative effect of
accounting change
Basic ......................... $ 1.38 1.19 1.11 1.01 .43
Diluted ........................ $ 1.29 1.09 .96 .94 .43
Cash dividends declared ............. $ .48 .36 .24 .12 .12
Balance Sheet Data:
Total assets ...................... $3,096,905 3,301,143 3,240,660 3,163,376 3,142,881
Total long-term debt ................ $ 494,917 528,389 626,822 688,204 1,059,115
Ratio of Earnings to Fixed Charges(1) .... 9.74 8.33 6.93 4.56 2.05
Weighted Average Number of Common
Shares:
Basic ........................... 167,100 178,303 176,540 173,748 172,720
Diluted.......................... 181,043 197,436 196,048 190,058 185,062
(1) For purposes of calculating the ratio of earnings to fixed charges, fixed charges include interest, amortiza-
tion of deferred debt expense and one-third of rentals; earnings available for fixed charges represent earn-
ings before fixed charges and income taxes.
See “Forward-Looking Information and Risk Factors That May Affect Future Results” contained in
Item 1A of this report for a discussion of risks and uncertainties that may affect future results. Also see
“Management’s Discussion and Analysis of Financial Condition and Results of Operations” contained in
Item 7 of this report for a discussion of factors affecting the comparability of information contained in this
Item 6.
20