Hasbro 2006 Annual Report Download - page 82
Download and view the complete annual report
Please find page 82 of the 2006 Hasbro annual report below. You can navigate through the pages in the report by either clicking on the pages listed below, or by using the keyword search tool below to find specific information within the annual report.-
 1
1 -
2
-
3
-
4
-
5
-
6
-
7
-
8
-
9
-
10
-
11
-
12
-
13
-
14
-
15
-
16
-
17
-
18
-
19
-
20
-
21
-
22
-
23
-
24
-
25
-
26
-
27
-
28
-
29
-
30
-
31
-
32
-
33
-
34
-
35
-
36
-
37
-
38
-
39
-
40
-
41
-
42
-
43
-
44
-
45
-
46
-
47
-
48
-
49
-
50
-
51
-
52
-
53
-
54
-
55
-
56
-
57
-
58
-
59
-
60
-
61
-
62
-
63
-
64
-
65
-
66
-
67
-
68
-
69
-
70
-
71
-
 72
72 -
 73
73 -
 74
74 -
 75
75 -
 76
76 -
 77
77 -
 78
78 -
 79
79 -
 80
80 -
 81
81 -
 82
82 -
 83
83 -
 84
84 -
 85
85 -
 86
86 -
 87
87 -
 88
88 -
 89
89 -
 90
90 -
 91
91 -
 92
92 -
93
-
94
-
95
-
96
-
97
-
98
-
99
-
100
-
101
-
102
-
103
 |
 |

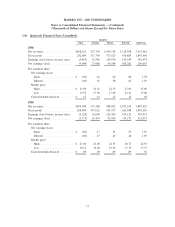
these assets to the individual operating segments are done prior to the start of the year based on budgeted
amounts. Any difference between actual and budgeted amounts are reflected in the Corporate segment.
(c) As noted in footnote 10, on December 26, 2005, the first day of fiscal 2006, the Company adopted
SFAS 123R using the modified prospective method. Under this method, the Company recorded stock
option compensation in 2006 related to unvested options as of that date as well as grants made in 2006.
The Company did not restate any of the prior years but has adjusted the operating profit (loss) of each of
its segments for 2005 and 2004 to reflect compensation for those periods based on the Company’s 2005
and 2004 pro forma disclosures under SFAS 123. As such, the above amounts represents the removal of
the amounts included in the segment disclosures to reconcile to the 2005 and 2004 reported consolidated
operating profit for 2005 and 2004. The $23,044 of 2005 pro forma stock option expense was allocated as
follows: $15,417 to North America, $4,309 to International, $1,774 to Global Operations and $1,544 to
Other Segment. The $22,164 of 2004 pro forma stock option expense was allocated as follows: $14,535
to North America, $4,187 to International, $1,824 to Global Operations and $1,618 to Other Segment.
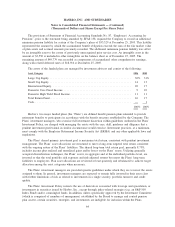
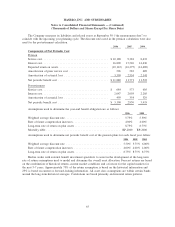
The following table presents consolidated net revenues by classes of principal products for the three fiscal
years ended December 31, 2006:
2006 2005 2004
Games and puzzles ............................... $1,294,110 1,246,422 1,316,031
Boys’ toys ...................................... 575,841 721,770 591,574
Preschool toys ................................... 406,663 334,729 381,424
Tweens toys .................................... 266,844 269,826 287,035
Girls’ toys ...................................... 540,298 446,822 367,734
Other.......................................... 67,725 68,058 53,712
Net revenues .................................... $3,151,481 3,087,627 2,997,510
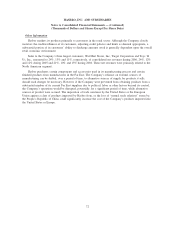
No individual product lines accounted for 10% or more of consolidated net revenues during 2006 or
2004. During 2005, revenues from STAR WARS related products accounted for 16% of consolidated net
revenues.
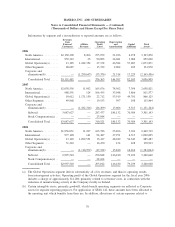
Information as to Hasbro’s operations in different geographical areas is presented below on the basis the
Company uses to manage its business. Net revenues are categorized based on location of the customer, while
long-lived assets (property, plant and equipment, goodwill and other intangibles) are categorized based on their
location:
2006 2005 2004
Net revenues
United States .................................. $1,898,865 1,846,217 1,782,295
International .................................. 1,252,616 1,241,410 1,215,215
$3,151,481 3,087,627 2,997,510
Long-lived assets
United States .................................. $1,051,124 1,127,100 1,151,852
International .................................. 132,797 117,439 162,737
$1,183,921 1,244,539 1,314,589
Principal international markets include Europe, Canada, Mexico, Australia, and Hong Kong.
71
HASBRO, INC. AND SUBSIDIARIES
Notes to Consolidated Financial Statements — (Continued)
(Thousands of Dollars and Shares Except Per Share Data)