Hasbro 2006 Annual Report Download - page 68
Download and view the complete annual report
Please find page 68 of the 2006 Hasbro annual report below. You can navigate through the pages in the report by either clicking on the pages listed below, or by using the keyword search tool below to find specific information within the annual report.-
 1
1 -
2
-
3
-
4
-
5
-
6
-
7
-
8
-
9
-
10
-
11
-
12
-
13
-
14
-
15
-
16
-
17
-
18
-
19
-
20
-
21
-
22
-
23
-
24
-
25
-
26
-
27
-
28
-
29
-
30
-
31
-
32
-
33
-
34
-
35
-
36
-
37
-
38
-
39
-
40
-
41
-
42
-
43
-
44
-
45
-
46
-
47
-
48
-
49
-
50
-
51
-
52
-
53
-
54
-
55
-
56
-
57
-
 58
58 -
 59
59 -
 60
60 -
 61
61 -
 62
62 -
 63
63 -
 64
64 -
 65
65 -
 66
66 -
 67
67 -
 68
68 -
 69
69 -
 70
70 -
 71
71 -
 72
72 -
 73
73 -
 74
74 -
 75
75 -
 76
76 -
 77
77 -
 78
78 -
79
-
80
-
81
-
82
-
83
-
84
-
85
-
86
-
87
-
88
-
89
-
90
-
91
-
92
-
93
-
94
-
95
-
96
-
97
-
98
-
99
-
100
-
101
-
102
-
103
 |
 |

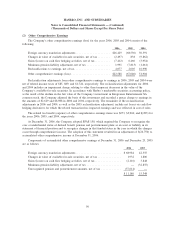
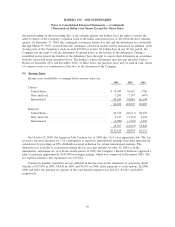
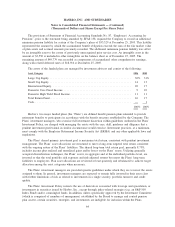
A reconciliation of the statutory United States federal income tax rate to Hasbro’s effective income tax
rate is as follows:
2006 2005 2004
Statutory income tax rate . ...................................... 35.0% 35.0% 35.0%
State and local income taxes, net ................................. 1.2 0.8 0.5
One time dividend ............................................ — 8.3 —
Tax on international earnings .................................... (9.7) (12.2) (12.9)
Fair value adjustment of liabilities potentially settleable in common stock . . . 3.3 (0.2) (1.7)
Change in valuation allowance ................................... 0.8 — 2.7
Settlement of tax examinations................................... 1.5 (1.4) —
Other, net .................................................. 0.5 1.5 1.0
32.6% 31.8% 24.6%
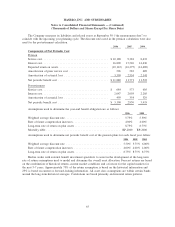
The components of earnings before income taxes, determined by tax jurisdiction, are as follows:
2006 2005 2004
United States ........................................ $113,761 98,180 71,759
International ........................................ 227,713 212,733 188,329
$341,474 310,913 260,088
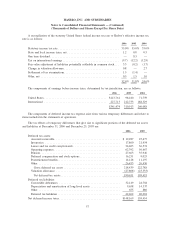
The components of deferred income tax expense arise from various temporary differences and relate to
items included in the statements of operations.
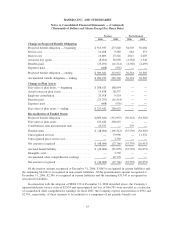
The tax effects of temporary differences that give rise to significant portions of the deferred tax assets
and liabilities at December 31, 2006 and December 25, 2005 are:
2006 2005
Deferred tax assets:
Accounts receivable.......................................... $ 19,287 25,477
Inventories ................................................ 17,860 21,454
Losses and tax credit carryforwards .............................. 34,405 36,574
Operating expenses .......................................... 62,392 56,667
Pension ................................................... 27,663 35,946
Deferred compensation and stock options .......................... 16,251 9,023
Postretirement benefits........................................ 14,128 11,197
Other .................................................... 26,453 26,450
Gross deferred tax assets .................................... 218,439 222,788
Valuation allowance.......................................... (27,808) (23,333)
Net deferred tax assets ...................................... 190,631 199,455
Deferred tax liabilities:
Convertible debentures ....................................... 32,149 24,784
Depreciation and amortization of long-lived assets ................... 9,658 14,337
Other .................................................... 655 880
Deferred tax liabilities ........................................ 42,462 40,001
Net deferred income taxes ....................................... $148,169 159,454
57
HASBRO, INC. AND SUBSIDIARIES
Notes to Consolidated Financial Statements — (Continued)
(Thousands of Dollars and Shares Except Per Share Data)