Hasbro 2006 Annual Report Download - page 76
Download and view the complete annual report
Please find page 76 of the 2006 Hasbro annual report below. You can navigate through the pages in the report by either clicking on the pages listed below, or by using the keyword search tool below to find specific information within the annual report.-
 1
1 -
2
-
3
-
4
-
5
-
6
-
7
-
8
-
9
-
10
-
11
-
12
-
13
-
14
-
15
-
16
-
17
-
18
-
19
-
20
-
21
-
22
-
23
-
24
-
25
-
26
-
27
-
28
-
29
-
30
-
31
-
32
-
33
-
34
-
35
-
36
-
37
-
38
-
39
-
40
-
41
-
42
-
43
-
44
-
45
-
46
-
47
-
48
-
49
-
50
-
51
-
52
-
53
-
54
-
55
-
56
-
57
-
58
-
59
-
60
-
61
-
62
-
63
-
64
-
65
-
 66
66 -
 67
67 -
 68
68 -
 69
69 -
 70
70 -
 71
71 -
 72
72 -
 73
73 -
 74
74 -
 75
75 -
 76
76 -
 77
77 -
 78
78 -
 79
79 -
 80
80 -
 81
81 -
 82
82 -
 83
83 -
 84
84 -
 85
85 -
 86
86 -
87
-
88
-
89
-
90
-
91
-
92
-
93
-
94
-
95
-
96
-
97
-
98
-
99
-
100
-
101
-
102
-
103
 |
 |

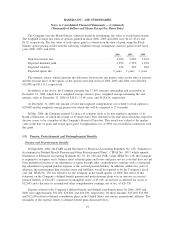
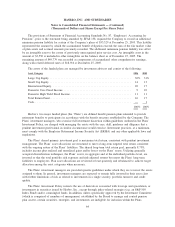
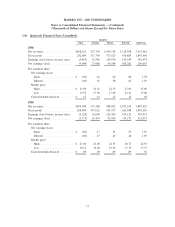
The Company measures its liabilities and related assets at September 30 (“the measurement date”) to
coincide with the upcoming year planning cycle. The discount rates used in the pension calculation were also
used for the postretirement calculation.
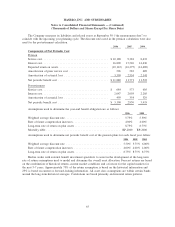
2006 2005 2004
Components of Net Periodic Cost
Pension
Service cost.......................................... $10,188 9,384 8,632
Interest cost.......................................... 16,809 15,526 14,630
Expected return on assets ................................ (19,112) (16,275) (14,489)
Amortization of prior service cost ......................... 596 582 609
Amortization of actuarial loss ............................ 3,399 2,554 2,141
Net periodic benefit cost ................................ $11,880 11,771 11,523
Postretirement
Service cost.......................................... $ 684 573 605
Interest cost.......................................... 2,047 2,003 2,285
Amortization of actuarial loss ............................ 459 354 529
Net periodic benefit cost ................................ $ 3,190 2,930 3,419
Assumptions used to determine the year-end benefit obligation are as follows:
2006 2005
Weighted average discount rate ................................... 5.75% 5.50%
Rate of future compensation increases .............................. 4.00% 4.00%
Long-term rate of return on plan assets ............................. 8.75% 8.75%
Mortality table . . . ............................................ RP-2000 RP-2000
Assumptions used to determine net periodic benefit cost of the pension plans for each fiscal year follow:
2006 2005 2004
Weighted average discount rate ................................... 5.50% 5.75% 6.00%
Rate of future compensation increases .............................. 4.00% 4.00% 4.00%
Long-term rate of return on plan assets .............................. 8.75% 8.75% 8.75%
Hasbro works with external benefit investment specialists to assist in the development of the long-term
rate of return assumptions used to model and determine the overall asset allocation. Forecast returns are based
on the combination of historical returns, current market conditions and a forecast for the capital markets for
the next 5-7 years. Approximately 75% of the return assumption is based on the historical information and
25% is based on current or forward-looking information. All asset class assumptions are within certain bands
around the long-term historical averages. Correlations are based primarily on historical return patterns.
65
HASBRO, INC. AND SUBSIDIARIES
Notes to Consolidated Financial Statements — (Continued)
(Thousands of Dollars and Shares Except Per Share Data)