Hasbro 2006 Annual Report Download - page 51
Download and view the complete annual report
Please find page 51 of the 2006 Hasbro annual report below. You can navigate through the pages in the report by either clicking on the pages listed below, or by using the keyword search tool below to find specific information within the annual report.-
 1
1 -
2
-
3
-
4
-
5
-
6
-
7
-
8
-
9
-
10
-
11
-
12
-
13
-
14
-
15
-
16
-
17
-
18
-
19
-
20
-
21
-
22
-
23
-
24
-
25
-
26
-
27
-
28
-
29
-
30
-
31
-
32
-
33
-
34
-
35
-
36
-
37
-
38
-
39
-
40
-
 41
41 -
 42
42 -
 43
43 -
 44
44 -
 45
45 -
 46
46 -
 47
47 -
 48
48 -
 49
49 -
 50
50 -
 51
51 -
 52
52 -
 53
53 -
 54
54 -
 55
55 -
 56
56 -
 57
57 -
 58
58 -
 59
59 -
 60
60 -
 61
61 -
62
-
63
-
64
-
65
-
66
-
67
-
68
-
69
-
70
-
71
-
72
-
73
-
74
-
75
-
76
-
77
-
78
-
79
-
80
-
81
-
82
-
83
-
84
-
85
-
86
-
87
-
88
-
89
-
90
-
91
-
92
-
93
-
94
-
95
-
96
-
97
-
98
-
99
-
100
-
101
-
102
-
103
 |
 |

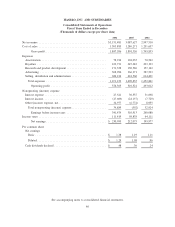
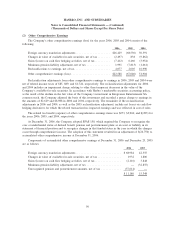
HASBRO, INC. AND SUBSIDIARIES
Consolidated Statements of Operations
Fiscal Years Ended in December
(Thousands of dollars except per share data)
2006 2005 2004
Net revenues ........................................... $3,151,481 3,087,627 2,997,510
Cost of sales ........................................... 1,303,885 1,286,271 1,251,657
Gross profit....................................... 1,847,596 1,801,356 1,745,853
Expenses
Amortization ......................................... 78,934 102,035 70,562
Royalties ............................................ 169,731 247,283 223,193
Research and product development ......................... 171,358 150,586 157,162
Advertising .......................................... 368,996 366,371 387,523
Selling, distribution and administration ...................... 682,214 624,560 614,401
Total expenses ...................................... 1,471,233 1,490,835 1,452,841
Operating profit ................................... 376,363 310,521 293,012
Nonoperating (income) expense
Interest expense ....................................... 27,521 30,537 31,698
Interest income ........................................ (27,609) (24,157) (7,729)
Other (income) expense, net .............................. 34,977 (6,772) 8,955
Total nonoperating (income) expense ...................... 34,889 (392) 32,924
Earnings before income taxes ......................... 341,474 310,913 260,088
Income taxes ........................................... 111,419 98,838 64,111
Net earnings ...................................... $ 230,055 212,075 195,977
Per common share
Net earnings
Basic ............................................. $ 1.38 1.19 1.11
Diluted ............................................ $ 1.29 1.09 .96
Cash dividends declared ................................. $ .48 .36 .24
See accompanying notes to consolidated financial statements.
40