Hasbro 2006 Annual Report Download - page 80
Download and view the complete annual report
Please find page 80 of the 2006 Hasbro annual report below. You can navigate through the pages in the report by either clicking on the pages listed below, or by using the keyword search tool below to find specific information within the annual report.-
 1
1 -
2
-
3
-
4
-
5
-
6
-
7
-
8
-
9
-
10
-
11
-
12
-
13
-
14
-
15
-
16
-
17
-
18
-
19
-
20
-
21
-
22
-
23
-
24
-
25
-
26
-
27
-
28
-
29
-
30
-
31
-
32
-
33
-
34
-
35
-
36
-
37
-
38
-
39
-
40
-
41
-
42
-
43
-
44
-
45
-
46
-
47
-
48
-
49
-
50
-
51
-
52
-
53
-
54
-
55
-
56
-
57
-
58
-
59
-
60
-
61
-
62
-
63
-
64
-
65
-
66
-
67
-
68
-
69
-
 70
70 -
 71
71 -
 72
72 -
 73
73 -
 74
74 -
 75
75 -
 76
76 -
 77
77 -
 78
78 -
 79
79 -
 80
80 -
 81
81 -
 82
82 -
 83
83 -
 84
84 -
 85
85 -
 86
86 -
 87
87 -
 88
88 -
 89
89 -
 90
90 -
91
-
92
-
93
-
94
-
95
-
96
-
97
-
98
-
99
-
100
-
101
-
102
-
103
 |
 |

Hasbro is party to certain legal proceedings, none of which, individually or in the aggregate, is deemed to
be material to the financial condition of the Company.
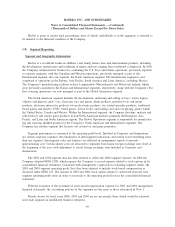
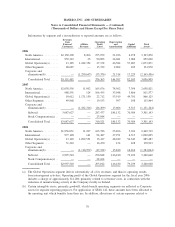
(15) Segment Reporting
Segment and Geographic Information
Hasbro is a worldwide leader in children’s and family leisure time and entertainment products, including
the development, manufacture and marketing of games and toys ranging from traditional to high-tech. In 2006
the Company restructured its business by combining the U.S. Toys and Games operations, previously reported
as separate segments, with the Canadian and Mexican operations, previously managed as part of the
International segment, into one segment, the North American segment. The International segment is now
comprised of operations in the Europe, Asia Pacific, South America and Latin America, excluding Mexico.
The Company’s manufacturing facilities in East Longmeadow, Massachusetts and Waterford, Ireland, which
were previously included in the Games and International segments, respectively, along with the Company’s Far
East sourcing operations, are now managed as part of the Global Operations segment.
The North American segment includes the development, marketing and selling of boys’ action figures,
vehicles and playsets, girls’ toys, electronic toys and games, plush products, preschool toys and infant
products, electronic interactive products, tween electronic products, toy-related specialty products, traditional
board games and puzzles, DVD- based games, fiction books, and trading card and role-playing games within
the United States, Canada and Mexico. Within the International segment, the Company develops, markets and
sells both toy and certain game products in non-North American markets, primarily the European, Asia
Pacific, and Latin and South American regions. The Global Operations segment is responsible for manufactur-
ing and sourcing finished product for the Company’s North American and International segments. The
Company has another segment that licenses out certain toy and game properties.
Segment performance is measured at the operating profit level. Included in Corporate and eliminations
are certain corporate expenses, the elimination of intersegment transactions and certain assets benefiting more
than one segment. Intersegment sales and transfers are reflected in management reports at amounts
approximating cost. Certain shared costs are allocated to segments based upon foreign exchange rates fixed at
the beginning of the year, with adjustment to actual foreign exchange rates included in Corporate and
eliminations.
The 2005 and 2004 segment data has been restated to reflect the 2006 segment structure. In 2006 the
Company adopted SFAS 123R, which requires the Company to record expense related to stock options in its
consolidated financial statements. Consistent with management’s approach in evaluating segment results, the
2005 and 2004 segment operating profit (loss) has been adjusted to include stock-based compensation as
disclosed under SFAS 123. The amount of 2005 and 2004 stock option expense is subtracted from the total
segment operating profit (loss) in order to reconcile to the operating profit (loss) in the consolidated financial
statements.
With the exception of the treatment of stock-based compensation expense for 2005 and 2004 management
financial statements, the accounting policies of the segments are the same as those referenced in Note 1.
Results shown for fiscal years 2006, 2005 and 2004 are not necessarily those which would be achieved
were each segment an unaffiliated business enterprise.
69
HASBRO, INC. AND SUBSIDIARIES
Notes to Consolidated Financial Statements — (Continued)
(Thousands of Dollars and Shares Except Per Share Data)