GameStop 2009 Annual Report Download - page 99
Download and view the complete annual report
Please find page 99 of the 2009 GameStop annual report below. You can navigate through the pages in the report by either clicking on the pages listed below, or by using the keyword search tool below to find specific information within the annual report.-
 1
1 -
2
-
3
-
4
-
5
-
6
-
7
-
8
-
9
-
10
-
11
-
12
-
13
-
14
-
15
-
16
-
17
-
18
-
19
-
20
-
21
-
22
-
23
-
24
-
25
-
26
-
27
-
28
-
29
-
30
-
31
-
32
-
33
-
34
-
35
-
36
-
37
-
38
-
39
-
40
-
41
-
42
-
43
-
44
-
45
-
46
-
47
-
48
-
49
-
50
-
51
-
52
-
53
-
54
-
55
-
56
-
57
-
58
-
59
-
60
-
61
-
62
-
63
-
64
-
65
-
66
-
67
-
68
-
69
-
70
-
71
-
72
-
73
-
74
-
75
-
76
-
77
-
78
-
79
-
80
-
81
-
82
-
83
-
84
-
85
-
86
-
87
-
88
-
 89
89 -
 90
90 -
 91
91 -
 92
92 -
 93
93 -
 94
94 -
 95
95 -
 96
96 -
 97
97 -
 98
98 -
 99
99 -
 100
100 -
 101
101 -
 102
102 -
 103
103 -
 104
104 -
 105
105 -
 106
106 -
 107
107 -
 108
108 -
 109
109 -
110
-
111
-
112
-
113
-
114
-
115
 |
 |

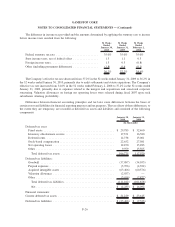
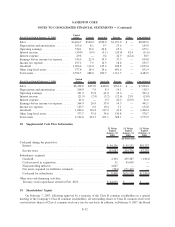
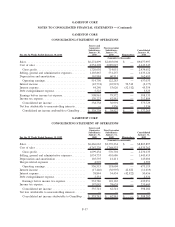
The following table sets forth gross profit (in millions) and gross profit percentages by significant product
category for the periods indicated:
Gross
Profit
Gross
Profit
Percent
Gross
Profit
Gross
Profit
Percent
Gross
Profit
Gross
Profit
Percent
52 Weeks
Ended
January 30,
2010
52 Weeks
Ended
January 31,
2009
52 Weeks
Ended
February 2,
2008
Gross Profit:
New video game hardware ................ $ 113.5 6.5% $ 112.6 6.1% $ 108.2 6.5%
New video game software ................ 795.0 21.3% 768.4 20.9% 581.7 20.8%
Used video game products ................ 1,121.2 46.8% 974.5 48.1% 772.2 48.7%
Other ................................ 405.0 33.8% 414.6 33.6% 351.6 33.9%
Total .............................. $2,434.7 26.8% $2,270.1 25.8% $1,813.7 25.6%
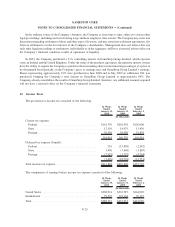
17. Segment Information
The Company operates its business in the following segments: United States, Canada, Australia and Europe.
The Company identifies segments based on a combination of geographic areas and management responsibility.
Each of the segments includes significant retail operations with all stores engaged in the sale of new and used video
game systems and software and personal computer entertainment software and related accessories. Segment results
for the United States include retail operations in 50 states, the District of Columbia, Guam and Puerto Rico, the
electronic commerce Web site www.gamestop.com and Game Informer Magazine. Segment results for Canada
include retail operations in Canada and segment results for Australia include retail operations in Australia and
New Zealand. Segment results for Europe include retail operations in 13 European countries. The fiscal 2009 results
of the European segment include Micromania’s results. The fiscal 2008 results of the European segment include
11 weeks of Micromania’s results. The Company measures segment profit using operating earnings, which is
defined as income from continuing operations before intercompany royalty fees, net interest expense and income
taxes. Transactions between reportable segments consist primarily of royalties, management fees, intersegment
loans and related interest.
Information on segments and the reconciliation to earnings before income taxes are as follows (in millions):
Fiscal Year Ended January 30, 2010
United
States Canada Australia Europe Other Consolidated
Sales ........................... $6,275.0 $491.4 $530.2 $1,781.4 $ — $9,078.0
Depreciation and amortization ......... 102.1 7.4 9.4 43.6 — 162.5
Operating earnings ................. 488.8 35.0 46.0 67.2 — 637.0
Interest income .................... (51.5) — (1.7) (1.4) 52.4 (2.2)
Interest expense ................... 44.2 — 0.1 53.5 (52.4) 45.4
Earnings before income tax expense .... 490.8 35.0 47.5 15.2 — 588.5
Income tax expense ................ 162.5 11.3 14.2 24.8 — 212.8
Goodwill ........................ 1,100.2 128.6 174.1 543.6 — 1,946.5
Other long-lived assets .............. 384.1 29.4 33.6 434.4 — 881.5
Total assets....................... 2,864.9 337.8 399.9 1,352.7 — 4,955.3
F-31
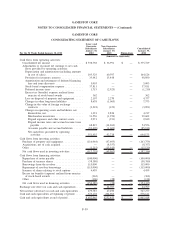
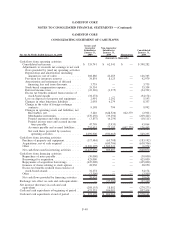
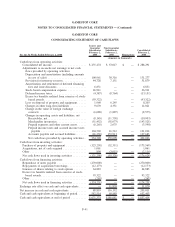
GAMESTOP CORP.
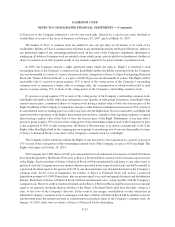
NOTES TO CONSOLIDATED FINANCIAL STATEMENTS — (Continued)