GameStop 2009 Annual Report Download - page 104
Download and view the complete annual report
Please find page 104 of the 2009 GameStop annual report below. You can navigate through the pages in the report by either clicking on the pages listed below, or by using the keyword search tool below to find specific information within the annual report.-
 1
1 -
2
-
3
-
4
-
5
-
6
-
7
-
8
-
9
-
10
-
11
-
12
-
13
-
14
-
15
-
16
-
17
-
18
-
19
-
20
-
21
-
22
-
23
-
24
-
25
-
26
-
27
-
28
-
29
-
30
-
31
-
32
-
33
-
34
-
35
-
36
-
37
-
38
-
39
-
40
-
41
-
42
-
43
-
44
-
45
-
46
-
47
-
48
-
49
-
50
-
51
-
52
-
53
-
54
-
55
-
56
-
57
-
58
-
59
-
60
-
61
-
62
-
63
-
64
-
65
-
66
-
67
-
68
-
69
-
70
-
71
-
72
-
73
-
74
-
75
-
76
-
77
-
78
-
79
-
80
-
81
-
82
-
83
-
84
-
85
-
86
-
87
-
88
-
89
-
90
-
91
-
92
-
93
-
 94
94 -
 95
95 -
 96
96 -
 97
97 -
 98
98 -
 99
99 -
 100
100 -
 101
101 -
 102
102 -
 103
103 -
 104
104 -
 105
105 -
 106
106 -
 107
107 -
 108
108 -
 109
109 -
 110
110 -
 111
111 -
 112
112 -
 113
113 -
 114
114 -
115
 |
 |

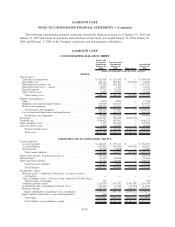
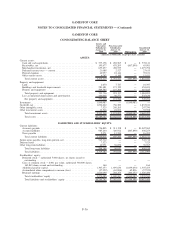
GAMESTOP CORP.
CONSOLIDATING BALANCE SHEET
Issuers and
Guarantor
Subsidiaries
January 31,
2009
Non-Guarantor
Subsidiaries
January 31,
2009 Eliminations
Consolidated
January 31,
2009
(Amounts in thousands, except per share amounts)
ASSETS:
Current assets:
Cash and cash equivalents. . . . . . . . . . . . . . . . . . . . . . . . . . . . . . . $ 373,178 $ 204,963 $ — $ 578,141
Receivables, net . . . . . . . . . . . . . . . . . . . . . . . . . . . . . . . . . . . . . 195,677 678,203 (807,899) 65,981
Merchandise inventories, net . . . . . . . . . . . . . . . . . . . . . . . . . . . . . 637,257 438,535 — 1,075,792
Deferred income taxes — current . . . . . . . . . . . . . . . . . . . . . . . . . . 21,088 2,527 — 23,615
Prepaid expenses . . . . . . . . . . . . . . . . . . . . . . . . . . . . . . . . . . . . . 40,957 18,144 — 59,101
Other current assets . . . . . . . . . . . . . . . . . . . . . . . . . . . . . . . . . . . 6,262 9,149 — 15,411
Total current assets . . . . . . . . . . . . . . . . . . . . . . . . . . . . . . . . . . 1,274,419 1,351,521 (807,899) 1,818,041
Property and equipment:
Land . . . . . . . . . . . . . . . . . . . . . . . . . . . . . . . . . . . . . . . . . . . . . 2,670 7,727 — 10,397
Buildings and leasehold improvements . . . . . . . . . . . . . . . . . . . . . . 281,481 173,170 — 454,651
Fixtures and equipment . . . . . . . . . . . . . . . . . . . . . . . . . . . . . . . . 509,585 110,260 — 619,845
Total property and equipment . . . . . . . . . . . . . . . . . . . . . . . . . . . 793,736 291,157 — 1,084,893
Less accumulated depreciation and amortization . . . . . . . . . . . . . . . . 436,068 99,571 — 535,639
Net property and equipment . . . . . . . . . . . . . . . . . . . . . . . . . . . . 357,668 191,586 — 549,254
Investment . . . . . . . . . . . . . . . . . . . . . . . . . . . . . . . . . . . . . . . . . . . 1,840,987 — (1,840,987) —
Goodwill, net . . . . . . . . . . . . . . . . . . . . . . . . . . . . . . . . . . . . . . . . . 1,096,622 736,389 — 1,833,011
Other intangible assets . . . . . . . . . . . . . . . . . . . . . . . . . . . . . . . . . . . 7,525 240,265 — 247,790
Other noncurrent assets . . . . . . . . . . . . . . . . . . . . . . . . . . . . . . . . . . 12,546 22,852 — 35,398
Total noncurrent assets . . . . . . . . . . . . . . . . . . . . . . . . . . . . . . . 3,315,348 1,191,092 (1,840,987) 2,665,453
Total assets . . . . . . . . . . . . . . . . . . . . . . . . . . . . . . . . . . . . . . . $4,589,767 $2,542,613 $(2,648,886) $4,483,494
LIABILITIES AND STOCKHOLDERS’ EQUITY:
Current liabilities:
Accounts payable . . . . . . . . . . . . . . . . . . . . . . . . . . . . . . . . . . . . $ 736,805 $ 311,158 $ — $1,047,963
Accrued liabilities . . . . . . . . . . . . . . . . . . . . . . . . . . . . . . . . . . . . 985,240 320,912 (807,899) 498,253
Taxes payable . . . . . . . . . . . . . . . . . . . . . . . . . . . . . . . . . . . . . . . 2,971 13,524 — 16,495
Total current liabilities . . . . . . . . . . . . . . . . . . . . . . . . . . . . . . . 1,725,016 645,594 (807,899) 1,562,711
Senior notes payable, long-term portion, net . . . . . . . . . . . . . . . . . . . . 545,712 — — 545,712
Deferred taxes . . . . . . . . . . . . . . . . . . . . . . . . . . . . . . . . . . . . . . . . 7,523 — — 7,523
Other long-term liabilities . . . . . . . . . . . . . . . . . . . . . . . . . . . . . . . . 40,931 56,032 — 96,963
Total long-term liabilities . . . . . . . . . . . . . . . . . . . . . . . . . . . . . 594,166 56,032 — 650,198
Total liabilities. . . . . . . . . . . . . . . . . . . . . . . . . . . . . . . . . . . . . 2,319,182 701,626 (807,899) 2,212,909
Stockholders’ equity:
Preferred stock — authorized 5,000 shares; no shares issued or
outstanding . . . . . . . . . . . . . . . . . . . . . . . . . . . . . . . . . . . . . . . — — — —
Class A common stock — $.001 par value; authorized 300,000 shares;
163,843 shares issued and outstanding . . . . . . . . . . . . . . . . . . . . . 164 — — 164
Additional paid-in-capital . . . . . . . . . . . . . . . . . . . . . . . . . . . . . . . 1,307,453 1,699,630 (1,699,630) 1,307,453
Accumulated other comprehensive income (loss) . . . . . . . . . . . . . . . (57,522) (62,896) 62,896 (57,522)
Retained earnings . . . . . . . . . . . . . . . . . . . . . . . . . . . . . . . . . . . . 1,020,490 204,253 (204,253) 1,020,490
Total stockholders’ equity . . . . . . . . . . . . . . . . . . . . . . . . . . . . . 2,270,585 1,840,987 (1,840,987) 2,270,585
Total liabilities and stockholders’ equity . . . . . . . . . . . . . . . . . . . $4,589,767 $2,542,613 $(2,648,886) $4,483,494
F-36
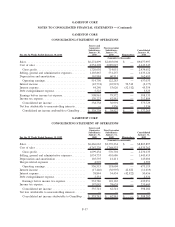
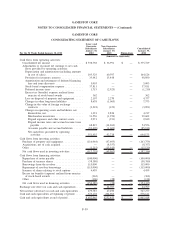
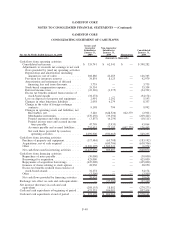
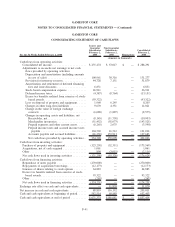
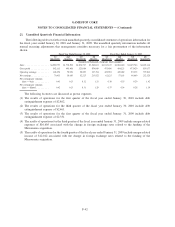
GAMESTOP CORP.
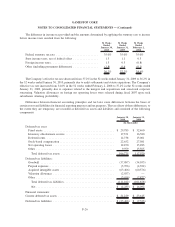
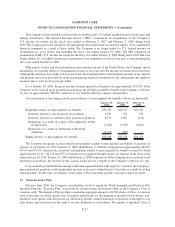
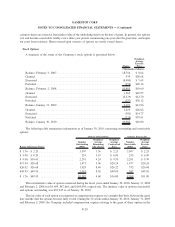
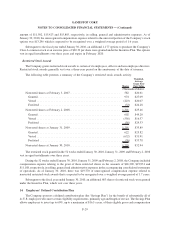
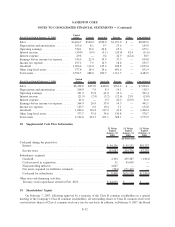
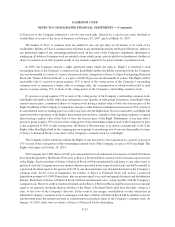
NOTES TO CONSOLIDATED FINANCIAL STATEMENTS — (Continued)