GameStop 2009 Annual Report Download - page 52
Download and view the complete annual report
Please find page 52 of the 2009 GameStop annual report below. You can navigate through the pages in the report by either clicking on the pages listed below, or by using the keyword search tool below to find specific information within the annual report.-
 1
1 -
2
-
3
-
4
-
5
-
6
-
7
-
8
-
9
-
10
-
11
-
12
-
13
-
14
-
15
-
16
-
17
-
18
-
19
-
20
-
21
-
22
-
23
-
24
-
25
-
26
-
27
-
28
-
29
-
30
-
31
-
32
-
33
-
34
-
35
-
36
-
37
-
38
-
39
-
40
-
41
-
 42
42 -
 43
43 -
 44
44 -
 45
45 -
 46
46 -
 47
47 -
 48
48 -
 49
49 -
 50
50 -
 51
51 -
 52
52 -
 53
53 -
 54
54 -
 55
55 -
 56
56 -
 57
57 -
 58
58 -
 59
59 -
 60
60 -
 61
61 -
 62
62 -
63
-
64
-
65
-
66
-
67
-
68
-
69
-
70
-
71
-
72
-
73
-
74
-
75
-
76
-
77
-
78
-
79
-
80
-
81
-
82
-
83
-
84
-
85
-
86
-
87
-
88
-
89
-
90
-
91
-
92
-
93
-
94
-
95
-
96
-
97
-
98
-
99
-
100
-
101
-
102
-
103
-
104
-
105
-
106
-
107
-
108
-
109
-
110
-
111
-
112
-
113
-
114
-
115
 |
 |
Australia
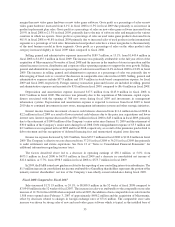
Segment results for Australia include retail operations in Australia and New Zealand. As of January 30, 2010,
the Australian segment included 388 stores, compared to 350 stores as of January 31, 2009. Sales for the 52 weeks
ended January 30, 2010 increased 2.0% compared to the 52 weeks ended January 31, 2009. The increase in sales
was due to the additional sales at the 112 stores opened since February 3, 2008 and the favorable impact of changes
in exchange rates, which had the effect of increasing sales by $5.2 million, offset by a decrease in sales at existing
stores. The decrease in sales at existing stores was primarily due to weak consumer traffic and a slow-down in
hardware unit sell-through. Segment operating income in the 52 weeks ended January 30, 2010 decreased by 1.7%
to $46.0 million when compared to the 52 weeks ended January 31, 2009. The decrease in operating earnings for the
52 weeks ended January 30, 2010 was due to the decrease in sales at existing stores and the increase in selling,
general and administrative expenses associated with the increase in the number of stores in operation. Selling,
general and administrative expenses will rise as a percentage of sales during periods of store count growth due to the
fixed nature of many store expenses compared to the immature sales at new stores. This decrease in operating
earnings was offset by the favorable impact of changes in exchange rates which had the effect of increasing
operating earnings by $3.6 million when compared to fiscal 2008.
Europe
Segment results for Europe include retail operations in 13 European countries including France, in which we
commenced operations on November 17, 2008 as a result of the Micromania acquisition. As of January 30, 2010,
the European segment operated 1,296 stores, compared to 1,201 stores as of January 31, 2009. For the 52 weeks
ended January 30, 2010, European sales increased 40.2% compared to the 52 weeks ended January 31, 2009. The
increase in sales was primarily due to the additional sales at the 703 new and acquired stores opened since
February 3, 2008, including the 328 stores from the Micromania acquisition in November 2008. This increase in
sales was offset by the decrease in sales at existing stores and the unfavorable impact of changes in exchange rates
recognized in fiscal 2009, which had the effect of decreasing sales by $15.3 million when compared to fiscal 2008.
The decrease in existing store sales was primarily driven by weak consumer traffic due to the continued
macroeconomic weakness and a slow-down in hardware unit sell-through.
The segment operating income in Europe for the 52 weeks ended January 30, 2010 increased by 2.4% to
$67.2 million compared to $65.6 million in the 52 weeks ended January 31, 2009. The increase in the operating
income was primarily due to the favorable impact of changes in exchange rates which had the effect of increasing
operating earnings by $5.2 million when compared to fiscal 2008. The decrease in operating earnings excluding the
exchange rate effect from fiscal 2008 was due to the decrease in sales at existing stores and the increase in selling,
general and administrative expenses associated with the increase in the number of stores in operation.
Fiscal 2008 Compared to Fiscal 2007
United States
As of January 31, 2009, the United States segment included 4,331 GameStop stores, compared to 4,061 stores
on February 2, 2008. Sales for the 52 weeks ended January 31, 2009 increased 18.9% compared to the 52 weeks
ended February 2, 2008 as a result of increased sales at existing stores and the opening of 643 new stores since
February 3, 2007, including 315 stores in the 52 weeks ended January 31, 2009. Sales at existing stores increased
due to strong sales of new video game software and used video game products which is typical in the years following
the release of new hardware platforms. As the installed base of the new hardware platforms expands, more new
software titles become available and trade-ins of used video game products applied toward the purchase of new
video games lead to increased sales of new and used video game products. Segment operating income for the
52 weeks ended January 31, 2009 increased by 35.5% compared to the 52 weeks ended February 2, 2008, driven by
strong sales of new video game software and used video game products and their related accessories, as well as the
leveraging of selling, general and administrative expenses.
37