GameStop 2009 Annual Report Download - page 48
Download and view the complete annual report
Please find page 48 of the 2009 GameStop annual report below. You can navigate through the pages in the report by either clicking on the pages listed below, or by using the keyword search tool below to find specific information within the annual report.-
 1
1 -
2
-
3
-
4
-
5
-
6
-
7
-
8
-
9
-
10
-
11
-
12
-
13
-
14
-
15
-
16
-
17
-
18
-
19
-
20
-
21
-
22
-
23
-
24
-
25
-
26
-
27
-
28
-
29
-
30
-
31
-
32
-
33
-
34
-
35
-
36
-
37
-
 38
38 -
 39
39 -
 40
40 -
 41
41 -
 42
42 -
 43
43 -
 44
44 -
 45
45 -
 46
46 -
 47
47 -
 48
48 -
 49
49 -
 50
50 -
 51
51 -
 52
52 -
 53
53 -
 54
54 -
 55
55 -
 56
56 -
 57
57 -
 58
58 -
59
-
60
-
61
-
62
-
63
-
64
-
65
-
66
-
67
-
68
-
69
-
70
-
71
-
72
-
73
-
74
-
75
-
76
-
77
-
78
-
79
-
80
-
81
-
82
-
83
-
84
-
85
-
86
-
87
-
88
-
89
-
90
-
91
-
92
-
93
-
94
-
95
-
96
-
97
-
98
-
99
-
100
-
101
-
102
-
103
-
104
-
105
-
106
-
107
-
108
-
109
-
110
-
111
-
112
-
113
-
114
-
115
 |
 |
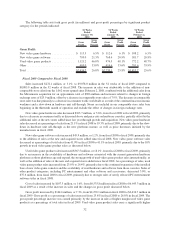
margin than new video game hardware or new video game software. Gross profit as a percentage of sales on new
video game hardware increased from 6.1% in fiscal 2008 to 6.5% in fiscal 2009 due primarily to an increase in
product replacement plan sales. Gross profit as a percentage of sales on new video game software increased from
20.9% in fiscal 2008 to 21.3% in fiscal 2009, primarily due to the mix of software sales and margin in the various
countries in which we operate. Gross profit as a percentage of sales on used video game products decreased from
48.1% in fiscal 2008 to 46.8% in fiscal 2009 primarily due to increased sales of used products in the international
segments as a percentage of total sales. International used product sales have a lower margin due to the immaturity
of the used business model in those segments. Gross profit as a percentage of sales on the other product sales
category increased slightly in fiscal 2009 when compared to fiscal 2008.
Selling, general and administrative expenses increased by $189.7 million, or 13.1%, from $1,445.4 million in
fiscal 2008 to $1,635.1 million in fiscal 2009. The increase was primarily attributable to the full year effect of the
acquisition of Micromania in November of fiscal 2008 and the increase in the number of stores in operation and the
related increases in store, distribution and corporate office operating expenses to support the store growth. Selling,
general and administrative expenses as a percentage of sales increased from 16.4% in fiscal 2008 to 18.0% in fiscal
2009. The increase in selling, general and administrative expenses as a percentage of sales was primarily due to
deleveraging of fixed costs as a result of the decrease in comparable store sales in fiscal 2009. Selling, general and
administrative expenses include $37.8 million and $35.4 million in stock-based compensation expense for fiscal
2009 and fiscal 2008, respectively. Foreign currency transaction gains and (losses) are included in selling, general
and administrative expenses and amounted to $3.8 million in fiscal 2009, compared to ($6.4) million in fiscal 2008.
Depreciation and amortization expense increased $17.5 million from $145.0 million in fiscal 2008 to
$162.5 million in fiscal 2009. This increase was primarily due to the acquisition of Micromania, capital expen-
ditures associated with the opening of 388 new stores during fiscal 2009 and investments in management
information systems. Depreciation and amortization expense is expected to increase from fiscal 2009 to fiscal
2010 due to continued investments in new stores, management information systems and other strategic initiatives.
Interest income from the investment of excess cash balances decreased from $11.6 million in fiscal 2008 to
$2.2 million in fiscal 2009 as a result of lower invested cash balances due to the prior year acquisitions and lower
interest rates. Interest expense decreased from $50.5 million in fiscal 2008 to $45.4 million in fiscal 2009, primarily
due to the retirement of $100.0 million of the Company’s senior notes since January 31, 2009 and the retirement of
$30.0 million of the Company’s senior notes during fiscal 2008. Debt extinguishment expense of $5.3 million and
$2.3 million was recognized in fiscal 2009 and fiscal 2008, respectively, as a result of the premiums paid related to
debt retirement and the recognition of deferred financing fees and unamortized original issue discount.
Income tax expense decreased by $22.9 million, from $235.7 million in fiscal 2008 to $212.8 million in fiscal
2009. The Company’s effective tax rate decreased from 37.2% in fiscal 2008 to 36.2% in fiscal 2009 due primarily
to audit settlements and statute expirations. See Note 12 of “Notes to Consolidated Financial Statements” for
additional information regarding income taxes.
The factors described above led to a decrease in operating earnings of $38.1 million, or 5.6%, from
$675.1 million in fiscal 2008 to $637.0 million in fiscal 2009 and a decrease in consolidated net income of
$22.6 million, or 5.7%, from $398.3 million in fiscal 2008 to $375.7 million in fiscal 2009.
In 2009, the FASB issued new guidance related to the reporting of non-controlling interests in subsidiaries. The
$1.5 million increase in consolidated net income attributable to GameStop shareholders represents the portion of the
minority interest shareholders’ net loss of the Company’s non-wholly owned subsidiaries during fiscal 2009.
Fiscal 2008 Compared to Fiscal 2007
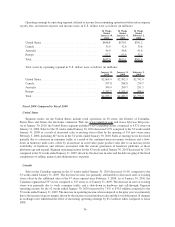
Sales increased $1,711.9 million, or 24.1%, to $8,805.9 million in the 52 weeks of fiscal 2008 compared to
$7,094.0 million in the 52 weeks of fiscal 2007. The increase in sales was attributable to the comparable store sales
increase of 12.3% for fiscal 2008 when compared to fiscal 2007, the addition of non-comparable store sales from the
1,588 stores opened since February 3, 2007 of approximately $698.2 million and the acquisition of Micromania,
offset by decreases related to changes in foreign exchange rates of $71.6 million. The comparable store sales
increase was driven by strong sales of new and used video game software which is typical as the installed base of
33