GameStop 2009 Annual Report Download - page 98
Download and view the complete annual report
Please find page 98 of the 2009 GameStop annual report below. You can navigate through the pages in the report by either clicking on the pages listed below, or by using the keyword search tool below to find specific information within the annual report.-
 1
1 -
2
-
3
-
4
-
5
-
6
-
7
-
8
-
9
-
10
-
11
-
12
-
13
-
14
-
15
-
16
-
17
-
18
-
19
-
20
-
21
-
22
-
23
-
24
-
25
-
26
-
27
-
28
-
29
-
30
-
31
-
32
-
33
-
34
-
35
-
36
-
37
-
38
-
39
-
40
-
41
-
42
-
43
-
44
-
45
-
46
-
47
-
48
-
49
-
50
-
51
-
52
-
53
-
54
-
55
-
56
-
57
-
58
-
59
-
60
-
61
-
62
-
63
-
64
-
65
-
66
-
67
-
68
-
69
-
70
-
71
-
72
-
73
-
74
-
75
-
76
-
77
-
78
-
79
-
80
-
81
-
82
-
83
-
84
-
85
-
86
-
87
-
 88
88 -
 89
89 -
 90
90 -
 91
91 -
 92
92 -
 93
93 -
 94
94 -
 95
95 -
 96
96 -
 97
97 -
 98
98 -
 99
99 -
 100
100 -
 101
101 -
 102
102 -
 103
103 -
 104
104 -
 105
105 -
 106
106 -
 107
107 -
 108
108 -
109
-
110
-
111
-
112
-
113
-
114
-
115
 |
 |

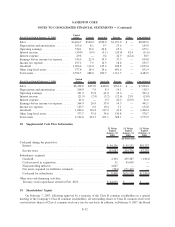
invested on a pre-tax basis. The Company’s optional contributions to the Savings Plan are generally in amounts
based upon a certain percentage of the employees’ contributions. The Company’s contributions to the Savings Plan
during the 52 weeks ended January 30, 2010, January 31, 2009 and February 2, 2008, were $3,323, $2,736 and
$2,235, respectively.
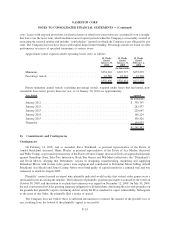
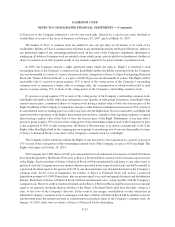
15. Certain Relationships and Related Transactions
The Company operates departments within seven bookstores operated by Barnes & Noble, a related party
through a common stockholder who is the Chairman of the Board of Directors of Barnes & Noble and a member of
the Company’s Board of Directors. The Company pays a license fee to Barnes & Noble on the gross sales of such
departments. The Company deems the license fee to be reasonable and based upon terms equivalent to those that
would prevail in an arm’s length transaction. During the 52 weeks ended January 30, 2010, January 31, 2009 and
February 2, 2008, these charges amounted to $1,077, $1,276 and $1,221, respectively.
In May 2005, the Company entered into an arrangement with Barnes & Noble under which
www.gamestop.com became the exclusive specialty video game retailer listed on www.bn.com, Barnes & Noble’s
e-commerce site. Under the terms of this agreement, the Company pays a fee to Barnes & Noble for sales of video
game or PC entertainment products sold through www.bn.com. For the 52 weeks ended January 30, 2010,
January 31, 2009 and February 2, 2008, the fee to Barnes & Noble totaled $374, $498 and $382, respectively.
Until June 2005, GameStop participated in Barnes & Noble’s workers’ compensation, property and general
liability insurance programs. The costs incurred by Barnes & Noble under these programs were allocated to
GameStop based upon total payroll expense, property and equipment, and insurance claim history of GameStop.
Management deemed the allocation methodology to be reasonable. Although GameStop secured its own insurance
coverage, costs will likely continue to be incurred by Barnes & Noble on insurance claims which were incurred
under its programs prior to June 2005 and any such costs applicable to insurance claims against GameStop will be
allocated to the Company. During the 52 weeks ended January 30, 2010, January 31, 2009 and February 2, 2008,
these allocated charges amounted to $179, $164 and $287, respectively.
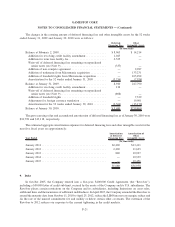
The Company had a promissory note in favor of Barnes & Noble in the principal amount of $74,020 in
connection with the repurchase of the Company’s common stock held by Barnes & Noble in October 2004. The note
was unsecured and bore interest at 5.5% per annum, payable with each principal installment. The final scheduled
principal payment of $12,173 was made in October 2007 and the note has been satisfied in full. Interest expense on
the promissory note for the 52 weeks ended February 2, 2008 totaled $444.
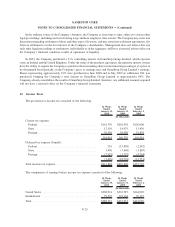
16. Significant Products
The following table sets forth sales (in millions) by significant product category for the periods indicated:
Sales
Percent
of Total Sales
Percent
of Total Sales
Percent
of Total
52 Weeks
Ended
January 30,
2010
52 Weeks
Ended
January 31,
2009
52 Weeks
Ended
February 2,
2008
Sales:
New video game hardware .............. $1,756.5 19.3% $1,860.2 21.1% $1,668.9 23.5%
New video game software .............. 3,730.9 41.1% 3,685.0 41.9% 2,800.7 39.5%
Used video game products .............. 2,394.1 26.4% 2,026.6 23.0% 1,586.7 22.4%
Other.............................. 1,196.5 13.2% 1,234.1 14.0% 1,037.7 14.6%
Total ............................ $9,078.0 100.0% $8,805.9 100.0% $7,094.0 100.0%
F-30
GAMESTOP CORP.
NOTES TO CONSOLIDATED FINANCIAL STATEMENTS — (Continued)