GameStop 2009 Annual Report Download - page 40
Download and view the complete annual report
Please find page 40 of the 2009 GameStop annual report below. You can navigate through the pages in the report by either clicking on the pages listed below, or by using the keyword search tool below to find specific information within the annual report.-
 1
1 -
2
-
3
-
4
-
5
-
6
-
7
-
8
-
9
-
10
-
11
-
12
-
13
-
14
-
15
-
16
-
17
-
18
-
19
-
20
-
21
-
22
-
23
-
24
-
25
-
26
-
27
-
28
-
29
-
 30
30 -
 31
31 -
 32
32 -
 33
33 -
 34
34 -
 35
35 -
 36
36 -
 37
37 -
 38
38 -
 39
39 -
 40
40 -
 41
41 -
 42
42 -
 43
43 -
 44
44 -
 45
45 -
 46
46 -
 47
47 -
 48
48 -
 49
49 -
 50
50 -
51
-
52
-
53
-
54
-
55
-
56
-
57
-
58
-
59
-
60
-
61
-
62
-
63
-
64
-
65
-
66
-
67
-
68
-
69
-
70
-
71
-
72
-
73
-
74
-
75
-
76
-
77
-
78
-
79
-
80
-
81
-
82
-
83
-
84
-
85
-
86
-
87
-
88
-
89
-
90
-
91
-
92
-
93
-
94
-
95
-
96
-
97
-
98
-
99
-
100
-
101
-
102
-
103
-
104
-
105
-
106
-
107
-
108
-
109
-
110
-
111
-
112
-
113
-
114
-
115
 |
 |

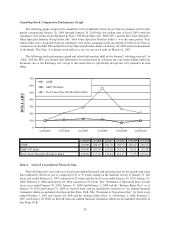
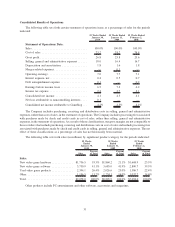
Our selected financial data set forth below should be read in conjunction with “Management’s Discussion and
Analysis of Financial Condition and Results of Operations” and the consolidated financial statements and notes
thereto included elsewhere in this Form 10-K.
52 Weeks
Ended
January 30,
2010
52 Weeks
Ended
January 31,
2009
52 Weeks
Ended
February 2,
2008
53 Weeks
Ended
February 3,
2007
52 Weeks
Ended
January 28,
2006(1)
(In thousands, except per share data and statistical data)
Statement of Operations Data:
Sales ......................... $9,077,997 $8,805,897 $7,093,962 $5,318,900 $3,091,783
Cost of sales .................... 6,643,345 6,535,762 5,280,255 3,847,458 2,219,753
Gross profit .................... 2,434,652 2,270,135 1,813,707 1,471,442 872,030
Selling, general and administrative
expenses(2) ................... 1,635,124 1,445,419 1,182,016 1,021,113 599,343
Depreciation and amortization ....... 162,495 145,004 130,270 109,862 66,355
Merger-related expenses(3) ......... — 4,593 — 6,788 13,600
Operating earnings . . ............. 637,033 675,119 501,421 333,679 192,732
Interest expense (income), net ....... 43,177 38,837 47,774 73,324 25,292
Merger-related interest expense(3) .... — — — — 7,518
Debt extinguishment expense ....... 5,323 2,331 12,591 6,059 —
Earnings before income tax expense . . 588,533 633,951 441,056 254,296 159,922
Income tax expense. . ............. 212,804 235,669 152,765 96,046 59,138
Consolidated net income ........... 375,729 398,282 288,291 158,250 100,784
Net loss attributable to noncontrolling
interests ..................... 1,536 — — — —
Consolidated net income attributable
to GameStop .................. $ 377,265 $ 398,282 $ 288,291 $ 158,250 $ 100,784
Basic net income per common
share(4) ..................... $ 2.29 $ 2.44 $ 1.82 $ 1.06 $ 0.87
Diluted net income per common
share(4) ..................... $ 2.25 $ 2.38 $ 1.75 $ 1.00 $ 0.81
Weighted average shares
outstanding — basic(4) .......... 164,525 163,190 158,226 149,924 115,840
Weighted average shares
outstanding — diluted(4) ......... 167,875 167,671 164,844 158,284 124,972
Store Operating Data:
Number of stores by segment
United States.................. 4,429 4,331 4,061 3,799 3,624
Canada ...................... 337 325 287 267 261
Australia ..................... 388 350 280 219 177
Europe ...................... 1,296 1,201 636 493 428
Total ........................ 6,450 6,207 5,264 4,778 4,490
Comparable store sales increase
(decrease)(5) .................. (7.9)% 12.3% 24.7% 11.9% (1.4)%
Inventory turnover . . ............. 5.2 5.8 6.0 5.2 5.0
Balance Sheet Data:
Working capital ................. $ 471,628 $ 255,330 $ 534,160 $ 353,284 $ 234,293
Total assets ..................... 4,955,327 4,483,494 3,775,891 3,349,584 3,015,821
Total debt, net .................. 447,343 545,712 574,473 855,484 975,990
Total liabilities .................. 2,232,316 2,212,909 1,913,445 1,973,706 1,901,108
Total equity .................... 2,723,011 2,270,585 1,862,446 1,375,878 1,114,713
25