GameStop 2009 Annual Report Download - page 54
Download and view the complete annual report
Please find page 54 of the 2009 GameStop annual report below. You can navigate through the pages in the report by either clicking on the pages listed below, or by using the keyword search tool below to find specific information within the annual report.-
 1
1 -
2
-
3
-
4
-
5
-
6
-
7
-
8
-
9
-
10
-
11
-
12
-
13
-
14
-
15
-
16
-
17
-
18
-
19
-
20
-
21
-
22
-
23
-
24
-
25
-
26
-
27
-
28
-
29
-
30
-
31
-
32
-
33
-
34
-
35
-
36
-
37
-
38
-
39
-
40
-
41
-
42
-
43
-
 44
44 -
 45
45 -
 46
46 -
 47
47 -
 48
48 -
 49
49 -
 50
50 -
 51
51 -
 52
52 -
 53
53 -
 54
54 -
 55
55 -
 56
56 -
 57
57 -
 58
58 -
 59
59 -
 60
60 -
 61
61 -
 62
62 -
 63
63 -
 64
64 -
65
-
66
-
67
-
68
-
69
-
70
-
71
-
72
-
73
-
74
-
75
-
76
-
77
-
78
-
79
-
80
-
81
-
82
-
83
-
84
-
85
-
86
-
87
-
88
-
89
-
90
-
91
-
92
-
93
-
94
-
95
-
96
-
97
-
98
-
99
-
100
-
101
-
102
-
103
-
104
-
105
-
106
-
107
-
108
-
109
-
110
-
111
-
112
-
113
-
114
-
115
 |
 |
Liquidity and Capital Resources
Cash Flows
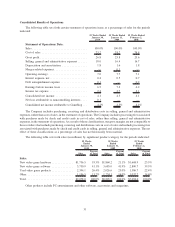
During fiscal 2009, cash provided by operations was $644.2 million, compared to cash provided by operations
of $549.2 million in fiscal 2008. The increase in cash provided by operations of $95.0 million from fiscal 2008 to
fiscal 2009 was primarily due to an increase in cash provided by the decrease in inventory, net of the decrease in
accounts payable and accrued liabilities, the increase in income taxes payable and deferred taxes, as well as the
changes in the adjustment related to the excess tax benefits realized from the exercise of stock-based awards which
decreased by $34.5 million. The decrease in net inventory was primarily due to lower overall purchases during fiscal
2009 as a result of the continued macroeconomic weakness and our efforts to effectively manage inventory levels.
Inventory turnover also decreased in fiscal 2009 compared to fiscal 2008, primarily due to the growth in the
international segments which have lower inventory turns compared to the United States segment due to their lower
overall store count and multiple warehouse facilities. The increase in cash related to income taxes payable and
deferred income taxes in fiscal 2009 compared to fiscal 2008 was primarily due to the timing of the recognition of
deferred income tax items and the timing of estimated income tax payments at the end of fiscal 2009.
During fiscal 2008, cash provided by operations was $549.2 million, compared to cash provided by operations
of $494.0 million in fiscal 2007. The increase in cash provided by operations of $55.2 million from fiscal 2007 to
fiscal 2008 was primarily due to an increase in cash provided by net earnings of $110.0 million, and a decrease in the
excess tax benefits realized from the exercise of stock-based awards of $59.1 million. These amounts were offset by
an increase in cash used in operations related to an increase in inventory, net of the increase in accounts payable and
accrued liabilities, and higher payments for income taxes due to the higher net income in fiscal 2008. The increase
in merchandise inventories in fiscal 2008 was primarily due to an increase in store count and sales levels.
Cash used in investing activities was $187.2 million in fiscal 2009, $820.9 million during fiscal 2008 and
$176.6 million during fiscal 2007. During fiscal 2009, the Company used $178.9 million for capital expenditures
primarily to open 388 new stores and to invest in information systems. In addition, the Company used $8.4 million
on acquisitions. During fiscal 2008, the Company used $580.4 million, net of cash acquired, to purchase
Micromania and $50.3 million, net of cash acquired, to acquire FRS, The Gamesman Limited and an increased
ownership interest in GameStop Group Limited. In addition, during fiscal 2008, $190.2 million of cash was used for
capital expenditures primarily to open 674 new stores and to invest in information systems. During fiscal 2007,
$177.7 million of cash was used for capital expenditures primarily to open 586 stores and to invest in information
systems.
Cash used in financing activities was $154.4 million in fiscal 2009. Cash provided by financing activities was
$29.6 million in fiscal 2008 and cash used in financing activities was $124.2 million in fiscal 2007. The cash flows
used in financing activities in fiscal 2009 were primarily for the repurchase of $100.0 million in principal amount of
the Company’s senior notes and the purchase of $58.4 million of treasury shares pursuant to the Board of Directors’
$300 million authorization in January 2010. The cash flows provided by financing activities in fiscal 2008 were due
to cash received related to the issuance of shares associated with stock option exercises of $29.0 million and for the
excess tax benefits realized from the exercise of stock-based awards of $34.2 million. These cash inflows were
offset by the repurchase of $30.0 million in principal amount of the Company’s senior notes. In addition, the
Company borrowed $425.0 million related to the acquisition of Micromania and subsequently repaid the balance
before the end of fiscal 2008. The cash used in financing activities for fiscal 2007 was primarily due to the
repurchase of $20.0 million and $250.0 million in principal amount of the Company’s senior notes and senior
floating rate notes, respectively, and the $12.2 million principal payment made in October 2007 on the Barnes &
Noble promissory note. These cash outflows were offset by $64.9 million received for the issuance of shares relating
to stock option exercises and $93.3 million for the realization of tax benefits relating to the exercise of stock-based
awards.
Sources of Liquidity
We utilize cash generated from operations and have funds available to us under our revolving credit facility to
cover seasonal fluctuations in cash flows and to support our various growth initiatives. Our cash and cash
39