GameStop 2009 Annual Report Download - page 51
Download and view the complete annual report
Please find page 51 of the 2009 GameStop annual report below. You can navigate through the pages in the report by either clicking on the pages listed below, or by using the keyword search tool below to find specific information within the annual report.-
 1
1 -
2
-
3
-
4
-
5
-
6
-
7
-
8
-
9
-
10
-
11
-
12
-
13
-
14
-
15
-
16
-
17
-
18
-
19
-
20
-
21
-
22
-
23
-
24
-
25
-
26
-
27
-
28
-
29
-
30
-
31
-
32
-
33
-
34
-
35
-
36
-
37
-
38
-
39
-
40
-
 41
41 -
 42
42 -
 43
43 -
 44
44 -
 45
45 -
 46
46 -
 47
47 -
 48
48 -
 49
49 -
 50
50 -
 51
51 -
 52
52 -
 53
53 -
 54
54 -
 55
55 -
 56
56 -
 57
57 -
 58
58 -
 59
59 -
 60
60 -
 61
61 -
62
-
63
-
64
-
65
-
66
-
67
-
68
-
69
-
70
-
71
-
72
-
73
-
74
-
75
-
76
-
77
-
78
-
79
-
80
-
81
-
82
-
83
-
84
-
85
-
86
-
87
-
88
-
89
-
90
-
91
-
92
-
93
-
94
-
95
-
96
-
97
-
98
-
99
-
100
-
101
-
102
-
103
-
104
-
105
-
106
-
107
-
108
-
109
-
110
-
111
-
112
-
113
-
114
-
115
 |
 |

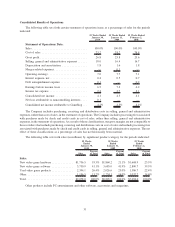
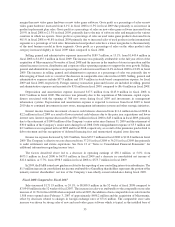
Operating earnings by operating segment, defined as income from continuing operations before intercompany
royalty fees, net interest expense and income taxes, in U.S. dollars were as follows (in millions):
52 Weeks
Ended
January 30,
2010
52 Weeks
Ended
January 31,
2009
52 Weeks
Ended
February 2,
2008
United States .................................... $488.8 $530.1 $391.2
Canada......................................... 35.0 32.6 35.8
Australia ....................................... 46.0 46.8 41.8
Europe ......................................... 67.2 65.6 32.6
Total .......................................... $637.0 $675.1 $501.4
Total assets by operating segment in U.S. dollars were as follows (in millions):
January 30,
2010
January 31,
2009
February 2,
2008
United States .................................... $2,864.9 $2,592.5 $2,742.0
Canada......................................... 337.8 288.8 274.7
Australia ....................................... 399.9 290.7 251.1
Europe ......................................... 1,352.7 1,311.5 508.1
Total .......................................... $4,955.3 $4,483.5 $3,775.9
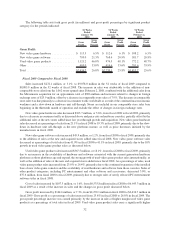
Fiscal 2009 Compared to Fiscal 2008
United States
Segment results for the United States include retail operations in 50 states, the District of Columbia,
Puerto Rico and Guam, the electronic commerce Web site www.gamestop.com and Game Informer Magazine.
As of January 30, 2010, the United States segment included 4,429 GameStop stores, compared to 4,331 stores on
January 31, 2009. Sales for the 52 weeks ended January 30, 2010 decreased 3.0% compared to the 52 weeks ended
January 31, 2009 as a result of decreased sales at existing stores offset by the opening of 514 new stores since
February 3, 2008, including 207 stores in the 52 weeks ended January 30, 2010. Sales at existing stores decreased
partially due to a decrease in consumer traffic as a result of the continued macroeconomic weakness and a slow-
down in hardware units sales, offset by an increase in used video game product sales due to an increase in the
availability of hardware and software associated with the current generation of hardware platforms as those
platforms age and expand. Segment operating income for the 52 weeks ended January 30, 2010 decreased by 7.8%
compared to the 52 weeks ended January 31, 2009, driven by the decrease in sales and the deleveraging of the fixed
components of selling, general and administrative expenses.
Canada
Sales in the Canadian segment in the 52 weeks ended January 30, 2010 decreased 10.4% compared to the
52 weeks ended January 31, 2009. The decrease in sales was primarily attributable to decreased sales at existing
stores offset by the additional sales at the 47 stores opened since February 3, 2008. As of January 30, 2010, the
Canadian segment had 337 stores compared to 325 stores as of January 31, 2009. The decrease in sales at existing
stores was primarily due to weak consumer traffic and a slow-down in hardware unit sell-through. Segment
operating income for the 52 weeks ended January 30, 2010 increased by 7.4% to $35.0 million compared to the
52 weeks ended January 31, 2009. The increase in operating income when compared to the prior year was primarily
due to the increase in gross margin, driven by the increase in used product sales and the favorable impact of changes
in exchange rates which had the effect of increasing operating earnings by $1.2 million when compared to fiscal
2008.
36