GameStop 2009 Annual Report Download - page 47
Download and view the complete annual report
Please find page 47 of the 2009 GameStop annual report below. You can navigate through the pages in the report by either clicking on the pages listed below, or by using the keyword search tool below to find specific information within the annual report.-
 1
1 -
2
-
3
-
4
-
5
-
6
-
7
-
8
-
9
-
10
-
11
-
12
-
13
-
14
-
15
-
16
-
17
-
18
-
19
-
20
-
21
-
22
-
23
-
24
-
25
-
26
-
27
-
28
-
29
-
30
-
31
-
32
-
33
-
34
-
35
-
36
-
 37
37 -
 38
38 -
 39
39 -
 40
40 -
 41
41 -
 42
42 -
 43
43 -
 44
44 -
 45
45 -
 46
46 -
 47
47 -
 48
48 -
 49
49 -
 50
50 -
 51
51 -
 52
52 -
 53
53 -
 54
54 -
 55
55 -
 56
56 -
 57
57 -
58
-
59
-
60
-
61
-
62
-
63
-
64
-
65
-
66
-
67
-
68
-
69
-
70
-
71
-
72
-
73
-
74
-
75
-
76
-
77
-
78
-
79
-
80
-
81
-
82
-
83
-
84
-
85
-
86
-
87
-
88
-
89
-
90
-
91
-
92
-
93
-
94
-
95
-
96
-
97
-
98
-
99
-
100
-
101
-
102
-
103
-
104
-
105
-
106
-
107
-
108
-
109
-
110
-
111
-
112
-
113
-
114
-
115
 |
 |

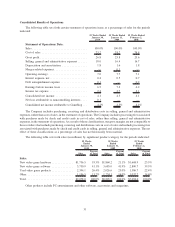
The following table sets forth gross profit (in millions) and gross profit percentages by significant product
category for the periods indicated:
Gross
Profit
Gross
Profit
Percent
Gross
Profit
Gross
Profit
Percent
Gross
Profit
Gross
Profit
Percent
52 Weeks
Ended
January 30,
2010
52 Weeks
Ended
January 31,
2009
52 Weeks
Ended
February 2,
2008
Gross Profit:
New video game hardware .............. $ 113.5 6.5% $ 112.6 6.1% $ 108.2 6.5%
New video game software ............... 795.0 21.3% 768.4 20.9% 581.7 20.8%
Used video game products .............. 1,121.2 46.8% 974.5 48.1% 772.2 48.7%
Other .............................. 405.0 33.8% 414.6 33.6% 351.6 33.9%
Total .............................. $2,434.7 26.8% $2,270.1 25.8% $1,813.7 25.6%
Fiscal 2009 Compared to Fiscal 2008
Sales increased $272.1 million, or 3.1%, to $9,078.0 million in the 52 weeks of fiscal 2009 compared to
$8,805.9 million in the 52 weeks of fiscal 2008. The increase in sales was attributable to the addition of non-
comparable store sales from the 1,062 stores opened since February 2, 2008, combined with the additional sales from
the Micromania acquisition for an approximate total of $896 million and increases related to changes in foreign
exchange rates of $25.9 million, offset by a decrease in comparable store sales of 7.9%. The decrease in comparable
store sales was due primarily to a decrease in consumer traffic worldwide as a result of the continued macroeconomic
weakness and a slow-down in hardware unit sell-through. Stores are included in our comparable store sales base
beginning in the thirteenth month of operation and exclude the effect of changes in foreign exchange rates.
New video game hardware sales decreased $103.7 million, or 5.6%, from fiscal 2008 to fiscal 2009, primarily
due to a decrease in consumer traffic as discussed above and price cuts on hardware consoles, partially offset by the
additional sales at the new stores added since last year through growth and acquisition. New video game hardware
sales decreased as a percentage of sales from 21.1% in fiscal 2008 to 19.3% in fiscal 2009, primarily due to the slow-
down in hardware unit sell-through as the new platforms mature, as well as price decreases initiated by the
manufacturers in fiscal 2009.
New video game software sales increased $45.9 million, or 1.2%, from fiscal 2008 to fiscal 2009, primarily due
to the addition of sales at the new and acquired stores added since fiscal 2008. New video game software sales
decreased as a percentage of total sales from 41.9% in fiscal 2008 to 41.1% in fiscal 2009, primarily due to the 18%
growth in used video game product sales as discussed below.
Used video game product sales increased $367.5 million, or 18.1%, from fiscal 2008 to fiscal 2009, primarily
due to an increase in the availability of hardware and software associated with the current generation hardware
platforms as those platforms age and expand, the strong growth of used video game product sales internationally, as
well as the addition of sales at the new and acquired stores added since fiscal 2008. As a percentage of sales, used
video game product sales increased from 23.0% to 26.4%, primarily due to the continued expansion of the installed
base of new video game consoles and the availability of used hardware and software from those consoles. Sales of
other product categories, including PC entertainment and other software and accessories, decreased 3.0%, or
$37.6 million, from fiscal 2008 to fiscal 2009, primarily due to stronger sales of newly released PC entertainment
software titles in fiscal 2008.
Cost of sales increased by $107.5 million, or 1.6%, from $6,535.8 million in fiscal 2008 to $6,643.3 million in
fiscal 2009 as a result of the increase in sales and the changes in gross profit discussed below.
Gross profit increased by $164.6 million, or 7.3%, from $2,270.1 million in fiscal 2008 to $2,434.7 million in
fiscal 2009. Gross profit as a percentage of sales increased from 25.8% in fiscal 2008 to 26.8% in fiscal 2009. The
gross profit percentage increase was caused primarily by the increase in sales of higher margin used video game
products as a percentage of total sales in fiscal 2009. Used video game product sales carry a significantly higher
32