GameStop 2009 Annual Report Download - page 73
Download and view the complete annual report
Please find page 73 of the 2009 GameStop annual report below. You can navigate through the pages in the report by either clicking on the pages listed below, or by using the keyword search tool below to find specific information within the annual report.-
 1
1 -
2
-
3
-
4
-
5
-
6
-
7
-
8
-
9
-
10
-
11
-
12
-
13
-
14
-
15
-
16
-
17
-
18
-
19
-
20
-
21
-
22
-
23
-
24
-
25
-
26
-
27
-
28
-
29
-
30
-
31
-
32
-
33
-
34
-
35
-
36
-
37
-
38
-
39
-
40
-
41
-
42
-
43
-
44
-
45
-
46
-
47
-
48
-
49
-
50
-
51
-
52
-
53
-
54
-
55
-
56
-
57
-
58
-
59
-
60
-
61
-
62
-
 63
63 -
 64
64 -
 65
65 -
 66
66 -
 67
67 -
 68
68 -
 69
69 -
 70
70 -
 71
71 -
 72
72 -
 73
73 -
 74
74 -
 75
75 -
 76
76 -
 77
77 -
 78
78 -
 79
79 -
 80
80 -
 81
81 -
 82
82 -
 83
83 -
84
-
85
-
86
-
87
-
88
-
89
-
90
-
91
-
92
-
93
-
94
-
95
-
96
-
97
-
98
-
99
-
100
-
101
-
102
-
103
-
104
-
105
-
106
-
107
-
108
-
109
-
110
-
111
-
112
-
113
-
114
-
115
 |
 |

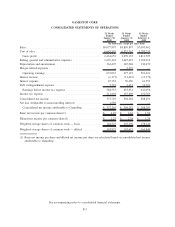
GAMESTOP CORP.
CONSOLIDATED STATEMENTS OF OPERATIONS
52 Weeks
Ended
January 30,
2010
52 Weeks
Ended
January 31,
2009
52 Weeks
Ended
February 2,
2008
(In thousands, except per share data)
Sales ............................................... $9,077,997 $8,805,897 $7,093,962
Cost of sales ......................................... 6,643,345 6,535,762 5,280,255
Gross profit ........................................ 2,434,652 2,270,135 1,813,707
Selling, general and administrative expenses .................. 1,635,124 1,445,419 1,182,016
Depreciation and amortization ............................. 162,495 145,004 130,270
Merger-related expenses ................................. — 4,593 —
Operating earnings ................................... 637,033 675,119 501,421
Interest income ........................................ (2,177) (11,619) (13,779)
Interest expense ....................................... 45,354 50,456 61,553
Debt extinguishment expense ............................. 5,323 2,331 12,591
Earnings before income tax expense ...................... 588,533 633,951 441,056
Income tax expense .................................... 212,804 235,669 152,765
Consolidated net income ................................. 375,729 398,282 288,291
Net loss attributable to noncontrolling interests ................ 1,536 — —
Consolidated net income attributable to GameStop ............ $ 377,265 $ 398,282 $ 288,291
Basic net income per common share(1) ...................... $ 2.29 $ 2.44 $ 1.82
Diluted net income per common share(1) .................... $ 2.25 $ 2.38 $ 1.75
Weighted average shares of common stock — basic ............. 164,525 163,190 158,226
Weighted average shares of common stock — diluted ........... 167,875 167,671 164,844
(1) Basic net income per share and diluted net income per share are calculated based on consolidated net income
attributable to GameStop.
See accompanying notes to consolidated financial statements.
F-5