GameStop 2009 Annual Report Download - page 72
Download and view the complete annual report
Please find page 72 of the 2009 GameStop annual report below. You can navigate through the pages in the report by either clicking on the pages listed below, or by using the keyword search tool below to find specific information within the annual report.-
 1
1 -
2
-
3
-
4
-
5
-
6
-
7
-
8
-
9
-
10
-
11
-
12
-
13
-
14
-
15
-
16
-
17
-
18
-
19
-
20
-
21
-
22
-
23
-
24
-
25
-
26
-
27
-
28
-
29
-
30
-
31
-
32
-
33
-
34
-
35
-
36
-
37
-
38
-
39
-
40
-
41
-
42
-
43
-
44
-
45
-
46
-
47
-
48
-
49
-
50
-
51
-
52
-
53
-
54
-
55
-
56
-
57
-
58
-
59
-
60
-
61
-
 62
62 -
 63
63 -
 64
64 -
 65
65 -
 66
66 -
 67
67 -
 68
68 -
 69
69 -
 70
70 -
 71
71 -
 72
72 -
 73
73 -
 74
74 -
 75
75 -
 76
76 -
 77
77 -
 78
78 -
 79
79 -
 80
80 -
 81
81 -
 82
82 -
83
-
84
-
85
-
86
-
87
-
88
-
89
-
90
-
91
-
92
-
93
-
94
-
95
-
96
-
97
-
98
-
99
-
100
-
101
-
102
-
103
-
104
-
105
-
106
-
107
-
108
-
109
-
110
-
111
-
112
-
113
-
114
-
115
 |
 |

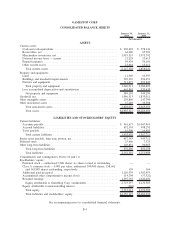
GAMESTOP CORP.
CONSOLIDATED BALANCE SHEETS
January 30,
2010
January 31,
2009
(In thousands)
ASSETS
Current assets:
Cash and cash equivalents ......................................... $ 905,418 $ 578,141
Receivables, net ................................................ 64,006 65,981
Merchandise inventories, net ....................................... 1,053,553 1,075,792
Deferred income taxes — current ................................... 21,229 23,615
Prepaid expenses ............................................... 59,434 59,101
Other current assets ............................................. 23,664 15,411
Total current assets ............................................ 2,127,304 1,818,041
Property and equipment:
Land ........................................................ 11,569 10,397
Buildings and leasehold improvements ............................... 522,965 454,651
Fixtures and equipment ........................................... 711,477 619,845
Total property and equipment .................................... 1,246,011 1,084,893
Less accumulated depreciation and amortization ........................ 661,810 535,639
Net property and equipment ..................................... 584,201 549,254
Goodwill, net .................................................... 1,946,513 1,833,011
Other intangible assets ............................................. 259,860 247,790
Other noncurrent assets ............................................ 37,449 35,398
Total noncurrent assets ......................................... 2,828,023 2,665,453
Total assets .................................................. $4,955,327 $4,483,494
LIABILITIES AND STOCKHOLDERS’ EQUITY
Current liabilities:
Accounts payable ............................................... $ 961,673 $1,047,963
Accrued liabilities............................................... 632,103 498,253
Taxes payable .................................................. 61,900 16,495
Total current liabilities ......................................... 1,655,676 1,562,711
Senior notes payable, long-term portion, net ............................. 447,343 545,712
Deferred taxes ................................................... 25,466 7,523
Other long-term liabilities ........................................... 103,831 96,963
Total long-term liabilities ....................................... 576,640 650,198
Total liabilities ............................................... 2,232,316 2,212,909
Commitments and contingencies (Notes 10 and 11)
Stockholders’ equity:
Preferred stock — authorized 5,000 shares; no shares issued or outstanding .... — —
Class A common stock — $.001 par value; authorized 300,000 shares; 158,662
and 163,843 shares outstanding, respectively ......................... 159 164
Additional paid-in-capital ......................................... 1,210,539 1,307,453
Accumulated other comprehensive income (loss) ........................ 114,704 (57,522)
Retained earnings ............................................... 1,397,755 1,020,490
Equity attributable to GameStop Corp. stockholders .................... 2,723,157 2,270,585
Equity attributable to noncontrolling interest . . ......................... (146) —
Total equity ................................................. 2,723,011 2,270,585
Total liabilities and stockholders’ equity . . . ......................... $4,955,327 $4,483,494
See accompanying notes to consolidated financial statements.
F-4