GameStop 2009 Annual Report Download - page 50
Download and view the complete annual report
Please find page 50 of the 2009 GameStop annual report below. You can navigate through the pages in the report by either clicking on the pages listed below, or by using the keyword search tool below to find specific information within the annual report.-
 1
1 -
2
-
3
-
4
-
5
-
6
-
7
-
8
-
9
-
10
-
11
-
12
-
13
-
14
-
15
-
16
-
17
-
18
-
19
-
20
-
21
-
22
-
23
-
24
-
25
-
26
-
27
-
28
-
29
-
30
-
31
-
32
-
33
-
34
-
35
-
36
-
37
-
38
-
39
-
 40
40 -
 41
41 -
 42
42 -
 43
43 -
 44
44 -
 45
45 -
 46
46 -
 47
47 -
 48
48 -
 49
49 -
 50
50 -
 51
51 -
 52
52 -
 53
53 -
 54
54 -
 55
55 -
 56
56 -
 57
57 -
 58
58 -
 59
59 -
 60
60 -
61
-
62
-
63
-
64
-
65
-
66
-
67
-
68
-
69
-
70
-
71
-
72
-
73
-
74
-
75
-
76
-
77
-
78
-
79
-
80
-
81
-
82
-
83
-
84
-
85
-
86
-
87
-
88
-
89
-
90
-
91
-
92
-
93
-
94
-
95
-
96
-
97
-
98
-
99
-
100
-
101
-
102
-
103
-
104
-
105
-
106
-
107
-
108
-
109
-
110
-
111
-
112
-
113
-
114
-
115
 |
 |

Interest income from the investment of excess cash balances decreased from $13.8 million in fiscal 2007 to
$11.6 million in fiscal 2008 as a result of lower invested cash balances due to acquisitions and lower interest rates.
Interest expense decreased from $61.6 million in fiscal 2007 to $50.5 million in fiscal 2008, primarily due to the
retirement of $30.0 million of the Company’s senior notes since February 2, 2008 and the retirement of
$270.0 million in senior notes and senior floating rate notes during fiscal 2007. Debt extinguishment expense
of $2.3 million and $12.6 million was recognized in fiscal 2008 and fiscal 2007, respectively, as a result of the
premiums paid related to debt retirement and the recognition of deferred financing fees and unamortized original
issue discount.
Income tax expense increased by $82.9 million, from $152.8 million in fiscal 2007 to $235.7 million in fiscal
2008. The Company’s effective tax rate increased from 34.6% in fiscal 2007 to 37.2% in fiscal 2008 due to expenses
related to mergers and acquisitions and associated corporate structuring and the deemed repatriation of earnings
from foreign subsidiaries. In addition, during fiscal 2007 there were valuation allowances released on foreign net
operating losses. See Note 12 of “Notes to Consolidated Financial Statements” for additional information regarding
income taxes.
The factors described above led to an increase in operating earnings of $173.7 million, or 34.6%, from
$501.4 million in fiscal 2007 to $675.1 million in fiscal 2008 and an increase in net earnings of $110.0 million, or
38.2%, from $288.3 million in fiscal 2007 to $398.3 million in fiscal 2008.
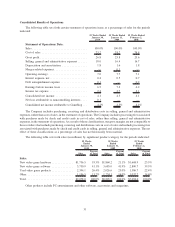
Segment Performance
The Company operates its business in the following segments: United States, Canada, Australia and Europe.
We identified these segments based on a combination of geographic areas, the methods with which we analyze
performance and how we divide management responsibility. Each of the segments consists primarily of retail
operations, with all stores engaged in the sale of new and used video game systems, software and accessories which
we refer to as video game products and PC entertainment software and related accessories. These products are
substantially the same regardless of geographic location, with the primary differences in merchandise carried being
the timing of the release of new products in the various segments. Stores in all segments are similar in size at an
average of approximately 1,400 square feet.
As we have expanded our presence in international markets, the Company has increased its operations in
foreign currencies, including the euro, Australian dollar, New Zealand dollar, Canadian dollar, British pound, Swiss
franc, Danish kroner, Swedish krona, and the Norwegian kroner. The notes issued in connection with the acquisition
of Micromania and the EB merger are reflected in the United States segment. See Note 17 of “Notes to Consolidated
Financial Statements” for more information.
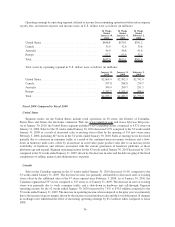
Sales by operating segment in U.S. dollars were as follows (in millions):
52 Weeks
Ended
January 30,
2010
52 Weeks
Ended
January 31,
2009
52 Weeks
Ended
February 2,
2008
United States .................................... $6,275.0 $6,466.7 $5,438.8
Canada......................................... 491.4 548.2 473.0
Australia ....................................... 530.2 520.0 420.8
Europe ......................................... 1,781.4 1,271.0 761.4
Total .......................................... $9,078.0 $8,805.9 $7,094.0
35