GameStop 2009 Annual Report Download - page 103
Download and view the complete annual report
Please find page 103 of the 2009 GameStop annual report below. You can navigate through the pages in the report by either clicking on the pages listed below, or by using the keyword search tool below to find specific information within the annual report.-
 1
1 -
2
-
3
-
4
-
5
-
6
-
7
-
8
-
9
-
10
-
11
-
12
-
13
-
14
-
15
-
16
-
17
-
18
-
19
-
20
-
21
-
22
-
23
-
24
-
25
-
26
-
27
-
28
-
29
-
30
-
31
-
32
-
33
-
34
-
35
-
36
-
37
-
38
-
39
-
40
-
41
-
42
-
43
-
44
-
45
-
46
-
47
-
48
-
49
-
50
-
51
-
52
-
53
-
54
-
55
-
56
-
57
-
58
-
59
-
60
-
61
-
62
-
63
-
64
-
65
-
66
-
67
-
68
-
69
-
70
-
71
-
72
-
73
-
74
-
75
-
76
-
77
-
78
-
79
-
80
-
81
-
82
-
83
-
84
-
85
-
86
-
87
-
88
-
89
-
90
-
91
-
92
-
 93
93 -
 94
94 -
 95
95 -
 96
96 -
 97
97 -
 98
98 -
 99
99 -
 100
100 -
 101
101 -
 102
102 -
 103
103 -
 104
104 -
 105
105 -
 106
106 -
 107
107 -
 108
108 -
 109
109 -
 110
110 -
 111
111 -
 112
112 -
 113
113 -
114
-
115
 |
 |

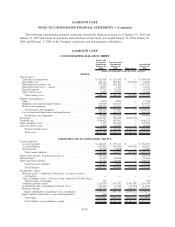
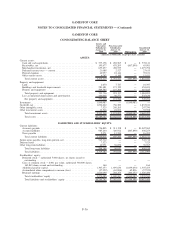
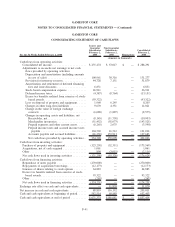
The following consolidating financial statements present the financial position as of January 30, 2010 and
January 31, 2009 and results of operations and cash flows for the fiscal years ended January 30, 2010, January 31,
2009 and February 2, 2008 of the Company’s guarantor and non-guarantor subsidiaries.
GAMESTOP CORP.
CONSOLIDATING BALANCE SHEET
Issuers and
Guarantor
Subsidiaries
January 30,
2010
Non-Guarantor
Subsidiaries
January 30,
2010 Eliminations
Consolidated
January 30,
2010
(Amounts in thousands, except per share amounts)
ASSETS:
Current assets:
Cash and cash equivalents. . . . . . . . . . . . . . . . . . . . . . . . . . . . . . . $ 652,965 $ 252,453 $ — $ 905,418
Receivables, net . . . . . . . . . . . . . . . . . . . . . . . . . . . . . . . . . . . . . 203,122 627,889 (767,005) 64,006
Merchandise inventories, net . . . . . . . . . . . . . . . . . . . . . . . . . . . . . 570,259 483,294 — 1,053,553
Deferred income taxes — current . . . . . . . . . . . . . . . . . . . . . . . . . . 18,076 3,153 — 21,229
Prepaid expenses . . . . . . . . . . . . . . . . . . . . . . . . . . . . . . . . . . . . . 37,750 21,684 — 59,434
Other current assets . . . . . . . . . . . . . . . . . . . . . . . . . . . . . . . . . . . 6,007 17,657 — 23,664
Total current assets . . . . . . . . . . . . . . . . . . . . . . . . . . . . . . . . . . 1,488,179 1,406,130 (767,005) 2,127,304
Property and equipment:
Land . . . . . . . . . . . . . . . . . . . . . . . . . . . . . . . . . . . . . . . . . . . . . 2,670 8,899 — 11,569
Buildings and leasehold improvements . . . . . . . . . . . . . . . . . . . . . . 296,348 226,617 — 522,965
Fixtures and equipment . . . . . . . . . . . . . . . . . . . . . . . . . . . . . . . . 569,924 141,553 — 711,477
Total property and equipment . . . . . . . . . . . . . . . . . . . . . . . . . . . 868,942 377,069 — 1,246,011
Less accumulated depreciation and amortization . . . . . . . . . . . . . . . . 498,534 163,276 — 661,810
Net property and equipment . . . . . . . . . . . . . . . . . . . . . . . . . . . . 370,408 213,793 — 584,201
Investment . . . . . . . . . . . . . . . . . . . . . . . . . . . . . . . . . . . . . . . . . . . 2,062,677 596,435 (2,659,112) —
Goodwill, net . . . . . . . . . . . . . . . . . . . . . . . . . . . . . . . . . . . . . . . . . 1,096,622 849,891 — 1,946,513
Other intangible assets . . . . . . . . . . . . . . . . . . . . . . . . . . . . . . . . . . . 3,376 256,484 — 259,860
Other noncurrent assets . . . . . . . . . . . . . . . . . . . . . . . . . . . . . . . . . . 9,466 27,983 — 37,449
Total noncurrent assets . . . . . . . . . . . . . . . . . . . . . . . . . . . . . . . 3,542,549 1,944,586 (2,659,112) 2,828,023
Total assets . . . . . . . . . . . . . . . . . . . . . . . . . . . . . . . . . . . . . . . $5,030,728 $3,350,716 $(3,426,117) $4,955,327
LIABILITIES AND STOCKHOLDERS’ EQUITY:
Current liabilities:
Accounts payable . . . . . . . . . . . . . . . . . . . . . . . . . . . . . . . . . . . . $ 684,256 $ 277,417 $ — $ 961,673
Accrued liabilities . . . . . . . . . . . . . . . . . . . . . . . . . . . . . . . . . . . . 1,039,840 359,268 (767,005) 632,103
Taxes payable . . . . . . . . . . . . . . . . . . . . . . . . . . . . . . . . . . . . . . . 63,988 (2,088) — 61,900
Total current liabilities . . . . . . . . . . . . . . . . . . . . . . . . . . . . . . . 1,788,084 634,597 (767,005) 1,655,676
Senior notes payable, long-term portion, net . . . . . . . . . . . . . . . . . . . . 447,343 — — 447,343
Deferred taxes . . . . . . . . . . . . . . . . . . . . . . . . . . . . . . . . . . . . . . . . (15,432) 40,898 — 25,466
Other long-term liabilities . . . . . . . . . . . . . . . . . . . . . . . . . . . . . . . . 87,722 16,109 — 103,831
Total long-term liabilities . . . . . . . . . . . . . . . . . . . . . . . . . . . . . 519,633 57,007 — 576,640
Total liabilities. . . . . . . . . . . . . . . . . . . . . . . . . . . . . . . . . . . . . 2,307,717 691,604 (767,005) 2,232,316
Stockholders’ equity:
Preferred stock — authorized 5,000 shares; no shares issued or
outstanding . . . . . . . . . . . . . . . . . . . . . . . . . . . . . . . . . . . . . . . — — — —
Class A common stock — $.001 par value; authorized 300,000 shares;
158,662 shares outstanding . . . . . . . . . . . . . . . . . . . . . . . . . . . . 159 — — 159
Additional paid-in-capital . . . . . . . . . . . . . . . . . . . . . . . . . . . . . . . 1,210,539 2,391,781 (2,391,781) 1,210,539
Accumulated other comprehensive income (loss) . . . . . . . . . . . . . . . 114,704 17,754 (17,754) 114,704
Retained earnings . . . . . . . . . . . . . . . . . . . . . . . . . . . . . . . . . . . . 1,397,755 249,577 (249,577) 1,397,755
Equity attributable to GameStop Corp. stockholders . . . . . . . . . . . . 2,723,157 2,659,112 (2,659,112) 2,723,157
Equity (deficit) attributable to noncontrolling interest . . . . . . . . . . . . (146) — — (146)
Total equity. . . . . . . . . . . . . . . . . . . . . . . . . . . . . . . . . . . . . . . 2,723,011 2,659,112 (2,659,112) 2,723,011
Total liabilities and stockholders’ equity . . . . . . . . . . . . . . . . . . . $5,030,728 $3,350,716 $(3,426,117) $4,955,327
F-35
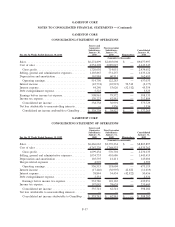
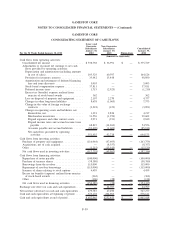
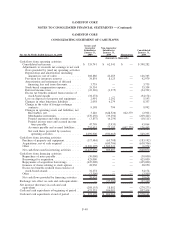
GAMESTOP CORP.
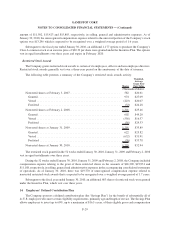
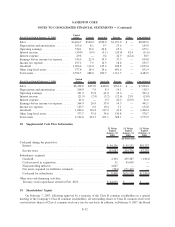
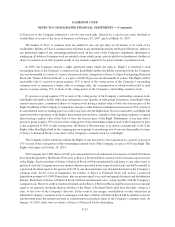
NOTES TO CONSOLIDATED FINANCIAL STATEMENTS — (Continued)