GameStop 2009 Annual Report Download - page 110
Download and view the complete annual report
Please find page 110 of the 2009 GameStop annual report below. You can navigate through the pages in the report by either clicking on the pages listed below, or by using the keyword search tool below to find specific information within the annual report.-
 1
1 -
2
-
3
-
4
-
5
-
6
-
7
-
8
-
9
-
10
-
11
-
12
-
13
-
14
-
15
-
16
-
17
-
18
-
19
-
20
-
21
-
22
-
23
-
24
-
25
-
26
-
27
-
28
-
29
-
30
-
31
-
32
-
33
-
34
-
35
-
36
-
37
-
38
-
39
-
40
-
41
-
42
-
43
-
44
-
45
-
46
-
47
-
48
-
49
-
50
-
51
-
52
-
53
-
54
-
55
-
56
-
57
-
58
-
59
-
60
-
61
-
62
-
63
-
64
-
65
-
66
-
67
-
68
-
69
-
70
-
71
-
72
-
73
-
74
-
75
-
76
-
77
-
78
-
79
-
80
-
81
-
82
-
83
-
84
-
85
-
86
-
87
-
88
-
89
-
90
-
91
-
92
-
93
-
94
-
95
-
96
-
97
-
98
-
99
-
 100
100 -
 101
101 -
 102
102 -
 103
103 -
 104
104 -
 105
105 -
 106
106 -
 107
107 -
 108
108 -
 109
109 -
 110
110 -
 111
111 -
 112
112 -
 113
113 -
 114
114 -
 115
115
 |
 |

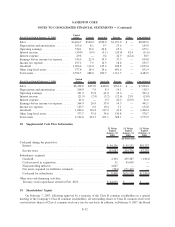
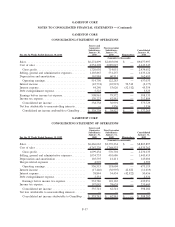
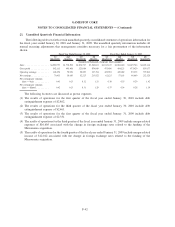
21. Unaudited Quarterly Financial Information
The following table sets forth certain unaudited quarterly consolidated statement of operations information for
the fiscal years ended January 30, 2010 and January 31, 2009. The unaudited quarterly information includes all
normal recurring adjustments that management considers necessary for a fair presentation of the information
shown.
1st
Quarter(1)
2nd
Quarter
3rd
Quarter(2)
4th
Quarter
1st
Quarter(3)
2nd
Quarter
3rd
Quarter(4)
4th
Quarter(5)
Fiscal Year Ended January 30, 2010 Fiscal Year Ended January 31, 2009
(Amounts in thousands, except per share amounts)
Sales ................. $1,980,753 $1,738,504 $1,834,727 $3,524,013 $1,813,617 $1,804,420 $1,695,746 $3,492,114
Gross profit ............. 542,113 495,406 523,084 874,049 473,406 484,123 473,429 839,177
Operating earnings ......... 128,454 70,956 90,269 347,354 109,903 100,069 85,335 379,812
Net earnings............. 70,433 38,685 52,225 215,922 62,125 57,163 46,669 232,325
Net earnings per common
share — basic .......... 0.43 0.23 0.32 1.31 0.38 0.35 0.29 1.42
Net earnings per common
share — diluted ......... 0.42 0.23 0.31 1.29 0.37 0.34 0.28 1.39
The following footnotes are discussed as pretax expenses.
(1) The results of operations for the first quarter of the fiscal year ended January 30, 2010 include debt
extinguishment expense of $2,862.
(2) The results of operations for the third quarter of the fiscal year ended January 30, 2010 include debt
extinguishment expense of $2,461.
(3) The results of operations for the first quarter of the fiscal year ended January 31, 2009 include debt
extinguishment expense of $2,331.
(4) The results of operations for the third quarter of the fiscal year ended January 31, 2009 include merger-related
expenses of $16,605 associated with the change in foreign exchange rates related to the funding of the
Micromania acquisition.
(5) The results of operations for the fourth quarter of the fiscal year ended January 31, 2009 include merger-related
income of $12,012 associated with the change in foreign exchange rates related to the funding of the
Micromania acquisition.
F-42
GAMESTOP CORP.
NOTES TO CONSOLIDATED FINANCIAL STATEMENTS — (Continued)