GameStop 2009 Annual Report Download - page 100
Download and view the complete annual report
Please find page 100 of the 2009 GameStop annual report below. You can navigate through the pages in the report by either clicking on the pages listed below, or by using the keyword search tool below to find specific information within the annual report.-
 1
1 -
2
-
3
-
4
-
5
-
6
-
7
-
8
-
9
-
10
-
11
-
12
-
13
-
14
-
15
-
16
-
17
-
18
-
19
-
20
-
21
-
22
-
23
-
24
-
25
-
26
-
27
-
28
-
29
-
30
-
31
-
32
-
33
-
34
-
35
-
36
-
37
-
38
-
39
-
40
-
41
-
42
-
43
-
44
-
45
-
46
-
47
-
48
-
49
-
50
-
51
-
52
-
53
-
54
-
55
-
56
-
57
-
58
-
59
-
60
-
61
-
62
-
63
-
64
-
65
-
66
-
67
-
68
-
69
-
70
-
71
-
72
-
73
-
74
-
75
-
76
-
77
-
78
-
79
-
80
-
81
-
82
-
83
-
84
-
85
-
86
-
87
-
88
-
89
-
 90
90 -
 91
91 -
 92
92 -
 93
93 -
 94
94 -
 95
95 -
 96
96 -
 97
97 -
 98
98 -
 99
99 -
 100
100 -
 101
101 -
 102
102 -
 103
103 -
 104
104 -
 105
105 -
 106
106 -
 107
107 -
 108
108 -
 109
109 -
 110
110 -
111
-
112
-
113
-
114
-
115
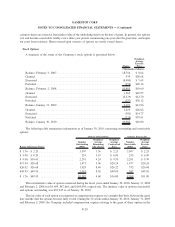
 |
 |

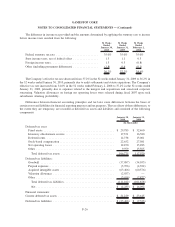
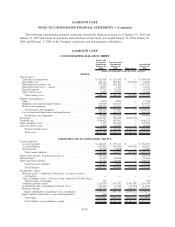
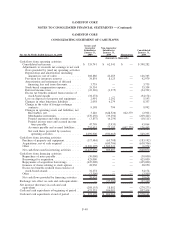
Fiscal Year Ended January 31, 2009
United
States Canada Australia Europe Other Consolidated
Sales ........................... $6,466.7 $548.2 $520.0 $1,271.0 $ — $8,805.9
Depreciation and amortization ......... 103.6 8.1 9.7 23.6 — 145.0
Operating earnings ................. 530.1 32.6 46.8 65.6 — 675.1
Interest income .................... (30.0) (0.9) (3.1) (20.0) 42.4 (11.6)
Interest expense ................... 49.8 — 0.2 42.9 (42.4) 50.5
Earnings before income tax expense .... 534.4 22.4 39.9 37.3 — 634.0
Income tax expense ................ 197.1 7.5 12.3 18.8 — 235.7
Goodwill ........................ 1,096.6 112.0 125.6 498.8 — 1,833.0
Other long-lived assets .............. 377.8 28.4 24.6 401.6 — 832.4
Total assets....................... 2,592.5 288.8 290.7 1,311.5 — 4,483.5
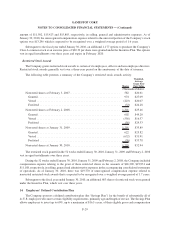
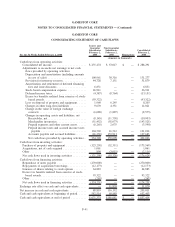
Fiscal Year Ended February 2, 2008
United
States Canada Australia Europe Other Consolidated
Sales............................. $5,438.8 $473.0 $420.8 $761.4 $ — $7,094.0
Depreciation and amortization .......... 100.0 7.9 8.3 14.1 — 130.3
Operating earnings .................. 391.2 35.8 41.8 32.6 — 501.4
Interest income ..................... (21.9) (2.0) (3.2) (12.6) 25.9 (13.8)
Interest expense..................... 61.0 — 0.3 26.2 (25.9) 61.6
Earnings before income tax expense...... 364.9 26.9 35.0 14.3 — 441.1
Income tax expense .................. 129.7 9.6 10.4 3.1 — 152.8
Goodwill.......................... 1,096.6 116.8 147.2 41.8 — 1,402.4
Other long-lived assets ............... 377.5 35.8 34.6 130.8 — 578.7
Total assets ........................ 2,742.0 274.7 251.1 508.1 — 3,775.9
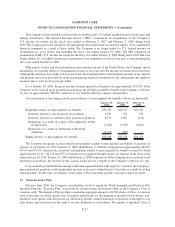
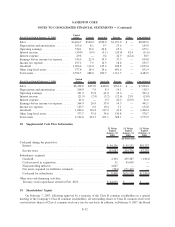
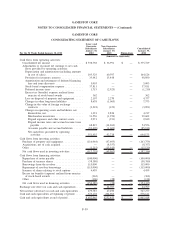
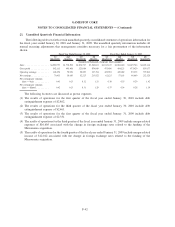
18. Supplemental Cash Flow Information
52 Weeks
Ended
January 30,
2010
52 Weeks
Ended
January 31,
2009
52 Weeks
Ended
February 2,
2008
(In thousands)
Cash paid during the period for:
Interest .............................................. $ 44,136 $ 45,252 $59,357
Income taxes .......................................... 153,083 204,776 47,792
Subsidiaries acquired:
Goodwill............................................. 4,194 459,287 (1,061)
Cash received in acquisition............................... 51 45,650 —
Noncontrolling interests .................................. 4,667 — —
Net assets acquired (or liabilities assumed) .................... (504) 171,419 —
Cash paid for subsidiaries ................................ $ 8,408 $676,356 $ (1,061)
Other non-cash financing activities:
Treasury stock repurchases settled in Feb. 2010 ................ $ 64,615 $ — $ —
19. Shareholders’ Equity
On February 7, 2007, following approval by a majority of the Class B common stockholders in a special
meeting of the Company’s Class B common stockholders, all outstanding shares of Class B common stock were
converted into shares of Class A common stock on a one-for-one basis. In addition, on February 9, 2007, the Board
F-32
GAMESTOP CORP.
NOTES TO CONSOLIDATED FINANCIAL STATEMENTS — (Continued)