GameStop 2009 Annual Report Download - page 85
Download and view the complete annual report
Please find page 85 of the 2009 GameStop annual report below. You can navigate through the pages in the report by either clicking on the pages listed below, or by using the keyword search tool below to find specific information within the annual report.-
 1
1 -
2
-
3
-
4
-
5
-
6
-
7
-
8
-
9
-
10
-
11
-
12
-
13
-
14
-
15
-
16
-
17
-
18
-
19
-
20
-
21
-
22
-
23
-
24
-
25
-
26
-
27
-
28
-
29
-
30
-
31
-
32
-
33
-
34
-
35
-
36
-
37
-
38
-
39
-
40
-
41
-
42
-
43
-
44
-
45
-
46
-
47
-
48
-
49
-
50
-
51
-
52
-
53
-
54
-
55
-
56
-
57
-
58
-
59
-
60
-
61
-
62
-
63
-
64
-
65
-
66
-
67
-
68
-
69
-
70
-
71
-
72
-
73
-
74
-
 75
75 -
 76
76 -
 77
77 -
 78
78 -
 79
79 -
 80
80 -
 81
81 -
 82
82 -
 83
83 -
 84
84 -
 85
85 -
 86
86 -
 87
87 -
 88
88 -
 89
89 -
 90
90 -
 91
91 -
 92
92 -
 93
93 -
 94
94 -
 95
95 -
96
-
97
-
98
-
99
-
100
-
101
-
102
-
103
-
104
-
105
-
106
-
107
-
108
-
109
-
110
-
111
-
112
-
113
-
114
-
115
 |
 |

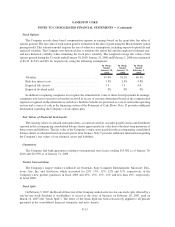
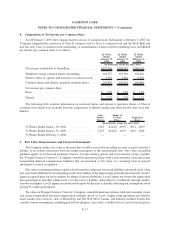
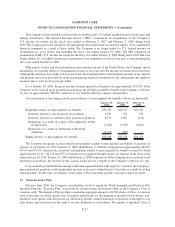
4. Computation of Net Income per Common Share
As of February 3, 2007, the Company had two classes of common stock. Subsequent to February 3, 2007, the
Company completed the conversion of Class B common stock to Class A common stock and the Stock Split and
now has only Class A common stock outstanding. A reconciliation of shares used in calculating basic and diluted
net income per common share is as follows:
52 Weeks
Ended
January 30,
2010
52 Weeks
Ended
January 31,
2009
52 Weeks
Ended
February 2,
2008
(In thousands, except per share data)
Net income attributable to GameStop .................. $377,265 $398,282 $288,291
Weighted average common shares outstanding ............ 164,525 163,190 158,226
Dilutive effect of options and warrants on common stock . . . 3,350 4,481 6,618
Common shares and dilutive potential common shares ...... 167,875 167,671 164,844
Net income per common share:
Basic .......................................... $ 2.29 $ 2.44 $ 1.82
Diluted......................................... $ 2.25 $ 2.38 $ 1.75
The following table contains information on restricted shares and options to purchase shares of Class A
common stock which were excluded from the computation of diluted earnings per share because they were anti-
dilutive:
Anti-
Dilutive
Shares
Range of
Exercise
Prices
Expiration
Dates
(In thousands, except per share data)
52 Weeks Ended January 30, 2010 .................. 3,218 $26.02 - 49.95 2011 - 2019
52 Weeks Ended January 31, 2009 .................. 2,473 $26.68 - 49.95 2010 - 2018
52 Weeks Ended February 2, 2008 .................. — — —
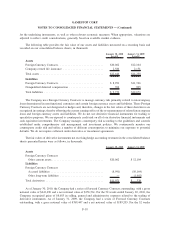
5. Fair Value Measurements and Financial Instruments
The Company defines fair value as the price that would be received from selling an asset or paid to transfer a
liability in an orderly transaction between market participants at the measurement date. Fair value accounting
guidance applies to our forward exchange contracts, foreign currency options and cross-currency swaps (together,
the “Foreign Currency Contracts”), Company-owned life insurance policies with a cash surrender value and certain
nonqualified deferred compensation liabilities that are measured at fair value on a recurring basis in periods
subsequent to initial recognition.
Fair value accounting guidance requires disclosures that categorize assets and liabilities measured at fair value
into one of three different levels depending on the observability of the inputs employed in the measurement. Level 1
inputs are quoted prices in active markets for identical assets or liabilities. Level 2 inputs are observable inputs other
than quoted prices included within Level 1 for the asset or liability, either directly or indirectly through market-
corroborated inputs. Level 3 inputs are unobservable inputs for the asset or liability reflecting our assumptions about
pricing by market participants.
We value our Foreign Currency Contracts, Company-owned life insurance policies with cash surrender values
and certain nonqualified deferred compensation liabilities based on Level 2 inputs using quotations provided by
major market news services, such as Bloomberg and The Wall Street Journal, and industry-standard models that
consider various assumptions, including quoted forward prices, time value, volatility factors, and contractual prices
F-17
GAMESTOP CORP.
NOTES TO CONSOLIDATED FINANCIAL STATEMENTS — (Continued)