GameStop 2008 Annual Report Download - page 85
Download and view the complete annual report
Please find page 85 of the 2008 GameStop annual report below. You can navigate through the pages in the report by either clicking on the pages listed below, or by using the keyword search tool below to find specific information within the annual report.-
 1
1 -
2
-
3
-
4
-
5
-
6
-
7
-
8
-
9
-
10
-
11
-
12
-
13
-
14
-
15
-
16
-
17
-
18
-
19
-
20
-
21
-
22
-
23
-
24
-
25
-
26
-
27
-
28
-
29
-
30
-
31
-
32
-
33
-
34
-
35
-
36
-
37
-
38
-
39
-
40
-
41
-
42
-
43
-
44
-
45
-
46
-
47
-
48
-
49
-
50
-
51
-
52
-
53
-
54
-
55
-
56
-
57
-
58
-
59
-
60
-
61
-
62
-
63
-
64
-
65
-
66
-
67
-
68
-
69
-
70
-
71
-
72
-
73
-
74
-
 75
75 -
 76
76 -
 77
77 -
 78
78 -
 79
79 -
 80
80 -
 81
81 -
 82
82 -
 83
83 -
 84
84 -
 85
85 -
 86
86 -
 87
87 -
 88
88 -
 89
89 -
 90
90 -
 91
91 -
 92
92 -
 93
93 -
 94
94 -
 95
95 -
96
-
97
-
98
-
99
-
100
-
101
-
102
-
103
-
104
-
105
-
106
-
107
-
108
-
109
-
110
-
111
-
112
-
113
-
114
 |
 |

marketing and advertising the vendors’ products. The Company’s accounting for cooperative advertising arrange-
ments and other vendor marketing programs, in accordance with FASB Emerging Issues Task Force Issue 02-16,
results in a portion of the consideration received from the Company’s vendors reducing the product costs in
inventory rather than as an offset to the Company’s marketing and advertising costs. The consideration serving as a
reduction in inventory is recognized in cost of sales as inventory is sold. The amount of vendor allowances to be
recorded as a reduction of inventory was determined by calculating the ratio of vendor allowances in excess of
specific, incremental and identifiable advertising and promotional costs to merchandise purchases. The Company
then applied this ratio to the value of inventory in determining the amount of vendor reimbursements to be recorded
as a reduction to inventory reflected on the balance sheet.
The cooperative advertising programs and other vendor marketing programs generally cover a period from a
few days up to a few weeks and include items such as product catalog advertising, in-store display promotions,
Internet advertising, co-op print advertising, product training and promotion at the Company’s annual store
managers conference. The allowance for each event is negotiated with the vendor and requires specific performance
by the Company to be earned.
Specific, incremental and identifiable advertising and promotional costs were $92,083 and $76,074 in the
52 week periods ended January 31, 2009 and February 2, 2008, respectively, and $49,585 in the 53 weeks ended
February 3, 2007. Vendor allowances received in excess of advertising expenses were recorded as a reduction of
cost of sales of $125,115 and $92,425 for the 52 week periods ended January 31, 2009 and February 2, 2008,
respectively, and $117,082 for the 53 weeks ended February 3, 2007. The amounts deferred as a reduction in
inventory were $3,193 for the 52 weeks ended January 31, 2009 and $1,377 for the 53 weeks ended February 3,
2007. The amount recognized as income related to the capitalization of excess vendor allowances was $6,113 for
the 52 weeks ended February 2, 2008.
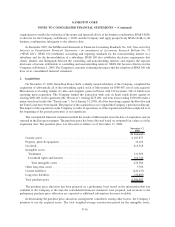
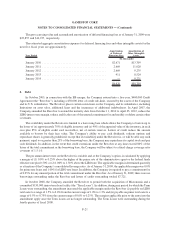
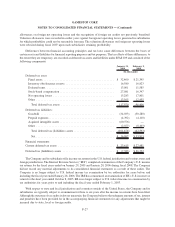
4. Computation of Net Earnings per Common Share
As of February 3, 2007, the Company had two classes of common stock. Subsequent to February 3, 2007, the
Company completed the Conversion and the Stock Split and now has only Class A common stock outstanding and
computed earnings per share in accordance with SFAS 128. A reconciliation of shares used in calculating basic and
diluted net earnings per common share is as follows:
52 Weeks
Ended
January 31,
2009
52 Weeks
Ended
February 2,
2008
53 Weeks
Ended
February 3,
2007
(In thousands, except per share data)
Net earnings ..................................... $398,282 $288,291 $158,250
Weighted average common shares outstanding ............ 163,190 158,226 149,924
Dilutive effect of options and warrants on common stock . . . 4,481 6,618 8,360
Common shares and dilutive potential common shares ...... 167,671 164,844 158,284
Net earnings per common share:
Basic .......................................... $ 2.44 $ 1.82 $ 1.06
Diluted......................................... $ 2.38 $ 1.75 $ 1.00
F-18
GAMESTOP CORP.
NOTES TO CONSOLIDATED FINANCIAL STATEMENTS — (Continued)