GameStop 2008 Annual Report Download - page 109
Download and view the complete annual report
Please find page 109 of the 2008 GameStop annual report below. You can navigate through the pages in the report by either clicking on the pages listed below, or by using the keyword search tool below to find specific information within the annual report.-
 1
1 -
2
-
3
-
4
-
5
-
6
-
7
-
8
-
9
-
10
-
11
-
12
-
13
-
14
-
15
-
16
-
17
-
18
-
19
-
20
-
21
-
22
-
23
-
24
-
25
-
26
-
27
-
28
-
29
-
30
-
31
-
32
-
33
-
34
-
35
-
36
-
37
-
38
-
39
-
40
-
41
-
42
-
43
-
44
-
45
-
46
-
47
-
48
-
49
-
50
-
51
-
52
-
53
-
54
-
55
-
56
-
57
-
58
-
59
-
60
-
61
-
62
-
63
-
64
-
65
-
66
-
67
-
68
-
69
-
70
-
71
-
72
-
73
-
74
-
75
-
76
-
77
-
78
-
79
-
80
-
81
-
82
-
83
-
84
-
85
-
86
-
87
-
88
-
89
-
90
-
91
-
92
-
93
-
94
-
95
-
96
-
97
-
98
-
 99
99 -
 100
100 -
 101
101 -
 102
102 -
 103
103 -
 104
104 -
 105
105 -
 106
106 -
 107
107 -
 108
108 -
 109
109 -
 110
110 -
 111
111 -
 112
112 -
 113
113 -
 114
114
 |
 |

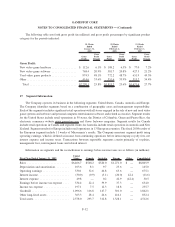
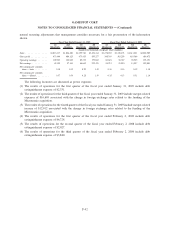
normal recurring adjustments that management considers necessary for a fair presentation of the information
shown.
1st
Quarter(1)
2nd
Quarter
3rd
Quarter(2)
4th
Quarter(3)
1st
Quarter(4)
2nd
Quarter(5)
3rd
Quarter(6)
4th
Quarter
Fiscal Year Ended January 31, 2009 Fiscal Year Ended February 2, 2008
(Amounts in thousands, except per share amounts)
Sales ................. $1,813,617 $1,804,420 $1,695,746 $3,492,114 $1,278,983 $1,338,193 $1,611,201 $2,865,585
Gross profit ............. 473,406 484,123 473,429 839,177 348,769 361,299 419,564 684,075
Operating earnings ......... 109,903 100,069 85,335 379,812 60,618 50,747 96,905 293,151
Net earnings............. 62,125 57,163 46,669 232,325 24,723 21,810 51,957 189,801
Net earnings per common
share — basic .......... 0.38 0.35 0.29 1.42 0.16 0.14 0.32 1.18
Net earnings per common
share — diluted ......... 0.37 0.34 0.28 1.39 0.15 0.13 0.31 1.14
The following footnotes are discussed as pretax expenses.
(1) The results of operations for the first quarter of the fiscal year ended January 31, 2009 include debt
extinguishment expense of $2,331.
(2) The results of operations for the third quarter of the fiscal year ended January 31, 2009 include merger-related
expenses of $16,605 associated with the change in foreign exchange rates related to the funding of the
Micromania acquisition.
(3) The results of operations for the fourth quarter of the fiscal year ended January 31, 2009 include merger-related
income of $12,012 associated with the change in foreign exchange rates related to the funding of the
Micromania acquisition.
(4) The results of operations for the first quarter of the fiscal year ended February 2, 2008 include debt
extinguishment expense of $6,724.
(5) The results of operations for the second quarter of the fiscal year ended February 2, 2008 include debt
extinguishment expense of $2,027.
(6) The results of operations for the third quarter of the fiscal year ended February 2, 2008 include debt
extinguishment expense of $3,840.
F-42
GAMESTOP CORP.
NOTES TO CONSOLIDATED FINANCIAL STATEMENTS — (Continued)