GameStop 2008 Annual Report Download - page 46
Download and view the complete annual report
Please find page 46 of the 2008 GameStop annual report below. You can navigate through the pages in the report by either clicking on the pages listed below, or by using the keyword search tool below to find specific information within the annual report.-
 1
1 -
2
-
3
-
4
-
5
-
6
-
7
-
8
-
9
-
10
-
11
-
12
-
13
-
14
-
15
-
16
-
17
-
18
-
19
-
20
-
21
-
22
-
23
-
24
-
25
-
26
-
27
-
28
-
29
-
30
-
31
-
32
-
33
-
34
-
35
-
 36
36 -
 37
37 -
 38
38 -
 39
39 -
 40
40 -
 41
41 -
 42
42 -
 43
43 -
 44
44 -
 45
45 -
 46
46 -
 47
47 -
 48
48 -
 49
49 -
 50
50 -
 51
51 -
 52
52 -
 53
53 -
 54
54 -
 55
55 -
 56
56 -
57
-
58
-
59
-
60
-
61
-
62
-
63
-
64
-
65
-
66
-
67
-
68
-
69
-
70
-
71
-
72
-
73
-
74
-
75
-
76
-
77
-
78
-
79
-
80
-
81
-
82
-
83
-
84
-
85
-
86
-
87
-
88
-
89
-
90
-
91
-
92
-
93
-
94
-
95
-
96
-
97
-
98
-
99
-
100
-
101
-
102
-
103
-
104
-
105
-
106
-
107
-
108
-
109
-
110
-
111
-
112
-
113
-
114
 |
 |

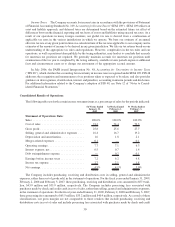
cards in selling, general and administrative expenses. The reclassifications had a net effect of 0.1%, 0.2% and 0.1%
of sales for the fiscal years ended January 31, 2009, February 2, 2008 and February 3, 2007, respectively.
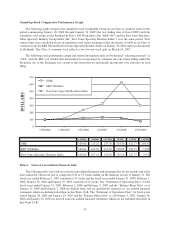
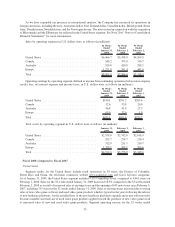
The following table sets forth sales (in millions) by significant product category for the periods indicated:
Sales
Percent
of Total Sales
Percent
of Total Sales
Percent
of Total
52 Weeks
Ended
January 31,
2009
52 Weeks
Ended
February 2,
2008
53 Weeks
Ended
February 3,
2007
Sales:
New video game hardware .............. $1,860.2 21.1% $1,668.9 23.5% $1,073.7 20.2%
New video game software .............. 3,685.0 41.9% 2,800.7 39.5% 2,012.5 37.8%
Used video game products .............. 2,026.6 23.0% 1,586.7 22.4% 1,316.0 24.8%
Other.............................. 1,234.1 14.0% 1,037.7 14.6% 916.7 17.2%
Total .............................. $8,805.9 100.0% $7,094.0 100.0% $5,318.9 100.0%
Other products include PC entertainment and other software and accessories, magazines and character-related
merchandise.
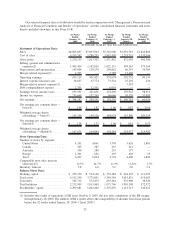
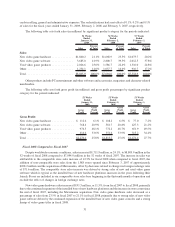
The following table sets forth gross profit (in millions) and gross profit percentages by significant product
category for the periods indicated:
Gross
Profit
Gross
Profit
Percent
Gross
Profit
Gross
Profit
Percent
Gross
Profit
Gross
Profit
Percent
52 Weeks
Ended
January 31,
2009
52 Weeks
Ended
February 2,
2008
53 Weeks
Ended
February 3,
2007
Gross Profit:
New video game hardware .............. $ 112.6 6.1% $ 108.2 6.5% $ 77.0 7.2%
New video game software ............... 768.4 20.9% 581.7 20.8% 427.3 21.2%
Used video game products .............. 974.5 48.1% 772.2 48.7% 651.9 49.5%
Other .............................. 414.6 33.6% 351.6 33.9% 315.2 34.4%
Total .............................. $2,270.1 25.8% $1,813.7 25.6% $1,471.4 27.7%
Fiscal 2008 Compared to Fiscal 2007
Despite worldwide economic conditions, sales increased $1,711.9 million, or 24.1%, to $8,805.9 million in the
52 weeks of fiscal 2008 compared to $7,094.0 million in the 52 weeks of fiscal 2007. The increase in sales was
attributable to the comparable store sales increase of 12.3% for fiscal 2008 when compared to fiscal 2007, the
addition of non-comparable store sales from the 1,588 stores opened since February 3, 2007 of approximately
$698.2 million and the acquisition of Micromania, offset by decreases related to changes in foreign exchange rates
of $71.6 million. The comparable store sales increase was driven by strong sales of new and used video game
software which is typical as the installed base of new hardware platforms increases in the years following their
launch. Stores are included in our comparable store sales base beginning in the thirteenth month of operation and
exclude the effect of changes in foreign exchange rates.
New video game hardware sales increased $191.3 million, or 11.5%, from fiscal 2007 to fiscal 2008, primarily
due to the continued expansion of the installed base of new hardware platforms and the increase in store count since
the end of fiscal 2007, including the Micromania acquisition. New video game hardware sales decreased as a
percentage of sales from 23.5% in fiscal 2007 to 21.1% in fiscal 2008, primarily due to strong sales of new video
game software driven by the continued expansion of the installed base of new video game consoles and a strong
lineup of video game titles in fiscal 2008.
31