GameStop 2008 Annual Report Download - page 100
Download and view the complete annual report
Please find page 100 of the 2008 GameStop annual report below. You can navigate through the pages in the report by either clicking on the pages listed below, or by using the keyword search tool below to find specific information within the annual report.-
 1
1 -
2
-
3
-
4
-
5
-
6
-
7
-
8
-
9
-
10
-
11
-
12
-
13
-
14
-
15
-
16
-
17
-
18
-
19
-
20
-
21
-
22
-
23
-
24
-
25
-
26
-
27
-
28
-
29
-
30
-
31
-
32
-
33
-
34
-
35
-
36
-
37
-
38
-
39
-
40
-
41
-
42
-
43
-
44
-
45
-
46
-
47
-
48
-
49
-
50
-
51
-
52
-
53
-
54
-
55
-
56
-
57
-
58
-
59
-
60
-
61
-
62
-
63
-
64
-
65
-
66
-
67
-
68
-
69
-
70
-
71
-
72
-
73
-
74
-
75
-
76
-
77
-
78
-
79
-
80
-
81
-
82
-
83
-
84
-
85
-
86
-
87
-
88
-
89
-
 90
90 -
 91
91 -
 92
92 -
 93
93 -
 94
94 -
 95
95 -
 96
96 -
 97
97 -
 98
98 -
 99
99 -
 100
100 -
 101
101 -
 102
102 -
 103
103 -
 104
104 -
 105
105 -
 106
106 -
 107
107 -
 108
108 -
 109
109 -
 110
110 -
111
-
112
-
113
-
114
 |
 |

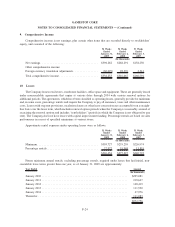
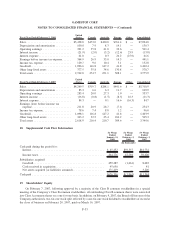
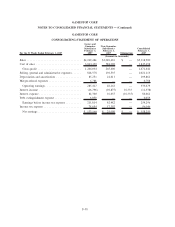
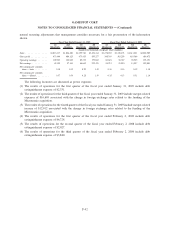
Fiscal Year Ended February 2, 2008
United
States Canada Australia Europe Other Consolidated
Sales............................. $5,438.8 $473.0 $420.8 $761.4 $ — $7,094.0
Depreciation and amortization .......... 100.0 7.9 8.3 14.1 — 130.3
Operating earnings .................. 391.2 35.8 41.8 32.6 — 501.4
Interest income ..................... (21.9) (2.0) (3.2) (12.6) 25.9 (13.8)
Interest expense..................... 61.0 — 0.3 26.2 (25.9) 61.6
Earnings before income tax expense...... 364.9 26.9 35.0 14.3 — 441.1
Income tax expense .................. 129.7 9.6 10.4 3.1 — 152.8
Goodwill.......................... 1,096.6 116.8 147.2 41.8 — 1,402.4
Other long-lived assets ............... 377.5 35.8 34.6 130.8 — 578.7
Total assets ........................ 2,742.0 274.7 251.1 508.1 — 3,775.9
Fiscal Year Ended February 3, 2007
United
States Canada Australia Europe Other Consolidated
Sales............................. $4,269.5 $319.7 $288.1 $441.6 $ — $5,318.9
Depreciation and amortization .......... 85.3 6.6 6.3 11.7 — 109.9
Operating earnings .................. 285.4 20.0 27.3 1.0 — 333.7
Interest income ..................... (16.8) (0.8) (1.5) (8.5) 16.3 (11.3)
Interest expense..................... 84.3 — 0.1 16.6 (16.3) 84.7
Earnings (loss) before income tax
expense ......................... 211.8 20.9 28.7 (7.1) — 254.3
Income tax expense .................. 78.6 7.4 8.8 1.2 — 96.0
Goodwill.......................... 1,098.1 116.8 147.2 41.8 — 1,403.9
Other long-lived assets ............... 343.2 32.5 25.4 104.2 — 505.3
Total assets ........................ 2,618.9 210.4 210.7 309.6 — 3,349.6
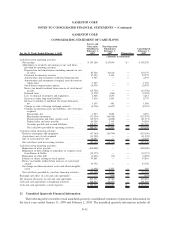
18. Supplemental Cash Flow Information
52 Weeks
Ended
January 31,
2009
52 Weeks
Ended
February 2,
2008
53 Weeks
Ended
February 3,
2007
(In thousands)
Cash paid during the period for:
Interest .............................................. $ 45,252 $59,357 $81,732
Income taxes .......................................... 204,776 47,792 59,620
Subsidiaries acquired:
Goodwill............................................. 459,287 (1,061) 8,083
Cash received in acquisition............................... 45,650 — 41
Net assets acquired (or liabilities assumed) .................... 171,419 — 3,220
Cash paid .............................................. $676,356 $ (1,061) $11,344
19. Shareholders’ Equity
On February 7, 2007, following approval by a majority of the Class B common stockholders in a special
meeting of the Company’s Class B common stockholders, all outstanding Class B common shares were converted
into Class A common shares on a one-for-one basis. In addition, on February 9, 2007, the Board of Directors of the
Company authorized a two-for-one stock split, effected by a one-for-one stock dividend to stockholders of record at
the close of business on February 20, 2007, paid on March 16, 2007.
F-33
GAMESTOP CORP.
NOTES TO CONSOLIDATED FINANCIAL STATEMENTS — (Continued)