GameStop 2008 Annual Report Download - page 45
Download and view the complete annual report
Please find page 45 of the 2008 GameStop annual report below. You can navigate through the pages in the report by either clicking on the pages listed below, or by using the keyword search tool below to find specific information within the annual report.-
 1
1 -
2
-
3
-
4
-
5
-
6
-
7
-
8
-
9
-
10
-
11
-
12
-
13
-
14
-
15
-
16
-
17
-
18
-
19
-
20
-
21
-
22
-
23
-
24
-
25
-
26
-
27
-
28
-
29
-
30
-
31
-
32
-
33
-
34
-
 35
35 -
 36
36 -
 37
37 -
 38
38 -
 39
39 -
 40
40 -
 41
41 -
 42
42 -
 43
43 -
 44
44 -
 45
45 -
 46
46 -
 47
47 -
 48
48 -
 49
49 -
 50
50 -
 51
51 -
 52
52 -
 53
53 -
 54
54 -
 55
55 -
56
-
57
-
58
-
59
-
60
-
61
-
62
-
63
-
64
-
65
-
66
-
67
-
68
-
69
-
70
-
71
-
72
-
73
-
74
-
75
-
76
-
77
-
78
-
79
-
80
-
81
-
82
-
83
-
84
-
85
-
86
-
87
-
88
-
89
-
90
-
91
-
92
-
93
-
94
-
95
-
96
-
97
-
98
-
99
-
100
-
101
-
102
-
103
-
104
-
105
-
106
-
107
-
108
-
109
-
110
-
111
-
112
-
113
-
114
 |
 |

Income Taxes. The Company accounts for income taxes in accordance with the provisions of Statement
of Financial Accounting Standards No. 109, Accounting for Income Taxes (“SFAS 109”). SFAS 109 utilizes an
asset and liability approach, and deferred taxes are determined based on the estimated future tax effect of
differences between the financial reporting and tax bases of assets and liabilities using enacted tax rates. As a
result of our operations in many foreign countries, our global tax rate is derived from a combination of
applicable tax rates in the various jurisdictions in which we operate. We base our estimate of an annual
effective tax rate at any given point in time on a calculated mix of the tax rates applicable to our company and to
estimates of the amount of income to be derived in any given jurisdiction. We file our tax returns based on our
understanding of the appropriate tax rules and regulations. However, complexities in the tax rules and our
operations, as well as positions taken publicly by the taxing authorities, may lead us to conclude that accruals
for uncertain tax positions are required. We generally maintain accruals for uncertain tax positions until
examination of the tax year is completed by the taxing authority, available review periods expire or additional
facts and circumstances cause us to change our assessment of the appropriate accrual amount.
In July 2006, the FASB issued Interpretation No. 48, Accounting for Uncertainty in Income Taxes
(“FIN 48”), which clarifies the accounting for uncertainty in income taxes recognized under SFAS 109. FIN 48
addresses the recognition and measurement of tax positions taken or expected to be taken, and also provides
guidance on derecognition, classification, interest and penalties, accounting in interim periods and disclosure.
For additional information related to the Company’s adoption of FIN 48, see Note 12 of “Notes to Consol-
idated Financial Statements.”
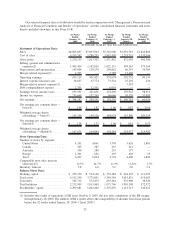
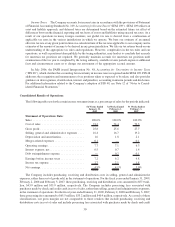
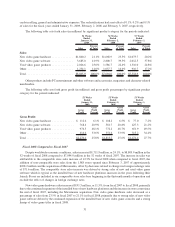
Consolidated Results of Operations
The following table sets forth certain income statement items as a percentage of sales for the periods indicated:
52 Weeks Ended
January 31,
2009
52 Weeks Ended
February 2,
2008
53 Weeks Ended
February 3,
2007
Statement of Operations Data:
Sales ................................. 100.0% 100.0% 100.0%
Cost of sales ........................... 74.2 74.4 72.3
Gross profit ............................ 25.8 25.6 27.7
Selling, general and administrative expenses .... 16.4 16.7 19.2
Depreciation and amortization............... 1.6 1.8 2.1
Merger-related expenses ................... 0.1 — 0.1
Operating earnings ....................... 7.7 7.1 6.3
Interest expense, net ...................... 0.5 0.7 1.4
Debt extinguishment expense ............... — 0.2 0.1
Earnings before income taxes ............... 7.2 6.2 4.8
Income tax expense ...................... 2.7 2.1 1.8
Net earnings............................ 4.5% 4.1% 3.0%
The Company includes purchasing, receiving and distribution costs in selling, general and administrative
expenses, rather than cost of goods sold, in the statement of operations. For the fiscal years ended January 31, 2009,
February 2, 2008 and February 3, 2007, these purchasing, receiving and distribution costs amounted to $57.0 mil-
lion, $43.9 million and $35.9 million, respectively. The Company includes processing fees associated with
purchases made by check and credit cards in cost of sales, rather than selling, general and administrative expenses,
in the statement of operations. For the fiscal years ended January 31, 2009, February 2, 2008 and February 3, 2007,
these processing fees amounted to $65.5 million, $55.2 million and $40.9 million, respectively. As a result of these
classifications, our gross margins are not comparable to those retailers that include purchasing, receiving and
distribution costs in cost of sales and include processing fees associated with purchases made by check and credit
30