GameStop 2008 Annual Report Download - page 52
Download and view the complete annual report
Please find page 52 of the 2008 GameStop annual report below. You can navigate through the pages in the report by either clicking on the pages listed below, or by using the keyword search tool below to find specific information within the annual report.-
 1
1 -
2
-
3
-
4
-
5
-
6
-
7
-
8
-
9
-
10
-
11
-
12
-
13
-
14
-
15
-
16
-
17
-
18
-
19
-
20
-
21
-
22
-
23
-
24
-
25
-
26
-
27
-
28
-
29
-
30
-
31
-
32
-
33
-
34
-
35
-
36
-
37
-
38
-
39
-
40
-
41
-
 42
42 -
 43
43 -
 44
44 -
 45
45 -
 46
46 -
 47
47 -
 48
48 -
 49
49 -
 50
50 -
 51
51 -
 52
52 -
 53
53 -
 54
54 -
 55
55 -
 56
56 -
 57
57 -
 58
58 -
 59
59 -
 60
60 -
 61
61 -
 62
62 -
63
-
64
-
65
-
66
-
67
-
68
-
69
-
70
-
71
-
72
-
73
-
74
-
75
-
76
-
77
-
78
-
79
-
80
-
81
-
82
-
83
-
84
-
85
-
86
-
87
-
88
-
89
-
90
-
91
-
92
-
93
-
94
-
95
-
96
-
97
-
98
-
99
-
100
-
101
-
102
-
103
-
104
-
105
-
106
-
107
-
108
-
109
-
110
-
111
-
112
-
113
-
114
 |
 |

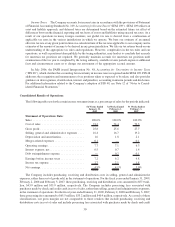
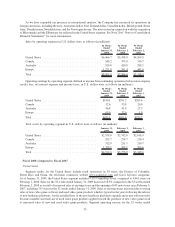
of changes in exchange rates since the prior year. For the 52 weeks ended January 31, 2009, changes in exchange
rates when compared to fiscal 2007 had the effect of decreasing operating earnings by $3.3 million.
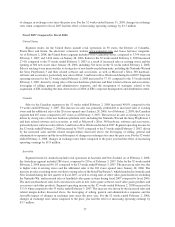
Fiscal 2007 Compared to Fiscal 2006
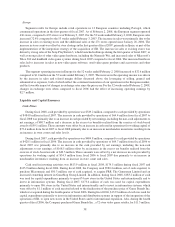
United States
Segment results for the United States include retail operations in 50 states, the District of Columbia,
Puerto Rico and Guam, the electronic commerce website www.gamestop.com and Game Informer magazine.
As of February 2, 2008, the United States segment included 4,061 GameStop stores, compared to 3,799 stores on
February 3, 2007, and 3,624 stores on January 28, 2006. Sales for the 52 weeks ended February 2, 2008 increased
27.4% compared to the 53 weeks ended February 3, 2007 as a result of increased sales at existing stores and the
opening of 604 new stores since January 28, 2006, including 328 stores in the 52 weeks ended February 2, 2008.
Sales at existing stores increased due to strong sales of new hardware platform units, including the Nintendo Wii and
the Sony PlayStation 3 and their related software and accessories, as well as Microsoft’s Xbox 360 hardware,
software and accessories, particularly new sales of Halo 3 and Guitar Hero III released during fiscal 2007. Segment
operating income for the 52 weeks ended February 2, 2008 increased by 37.1% compared to the 53 weeks ended
February 3, 2007, driven by strong sales of the new hardware platforms and their related software and accessories,
leveraging of selling, general and administrative expenses, and the recognition of synergies related to the
acquisition of EB, including the shut-down in fiscal 2006 of EB’s corporate headquarters and distribution center.
Canada
Sales in the Canadian segment in the 52 weeks ended February 2, 2008 increased 48.0% compared to the
53 weeks ended February 3, 2007. The increase in sales was primarily attributable to increased sales at existing
stores and the additional sales at the 28 stores opened since January 28, 2006. As of February 2, 2008, the Canadian
segment had 287 stores compared to 267 stores as of February 3, 2007. The increase in sales at existing stores was
driven by strong sales of the new hardware platform units, including the Nintendo Wii and the Sony PlayStation 3
and their related software and accessories, as well as Microsoft’s Xbox 360 hardware, software and accessories,
particularly new software sales of Halo 3 and Guitar Hero III released in fiscal 2007. Segment operating income for
the 52 weeks ended February 2, 2008 increased by 79.0% compared to the 53 weeks ended February 3, 2007, driven
by the increased sales and the related margin dollars discussed above, the leveraging of selling, general and
administrative expenses and the favorable impact of changes in exchange rates since the prior year. For the 52 weeks
ended February 2, 2008, changes in exchange rates when compared to the prior year had the effect of increasing
operating earnings by $1.9 million.
Australia
Segment results for Australia include retail operations in Australia and New Zealand. As of February 2, 2008,
the Australian segment included 280 stores, compared to 219 as of February 3, 2007. Sales for the 52 weeks ended
February 2, 2008 increased 46.1% compared to the 53 weeks ended February 3, 2007. The increase in sales was due
to higher sales at existing stores and the additional sales at the 104 stores opened since January 28, 2006. The
increase in sales at existing stores was due to strong sales of the Sony PlayStation 3, which launched in Australia and
New Zealand during the first quarter of fiscal 2007, as well as strong sales of other video game hardware, including
the Nintendo Wii, and increased sales of handheld video game systems during fiscal 2007 compared to fiscal 2006.
The increased hardware sales led to increases in sales in new video game software, used video game products and
accessories and other products. Segment operating income in the 52 weeks ended February 2, 2008 increased by
53.1% when compared to the 53 weeks ended February 3, 2007. The increase was driven by the increased sales and
related margin dollars discussed above, the leveraging of selling, general and administrative expenses and the
favorable impact of changes in exchange rates since the prior year. For the 52 weeks ended February 2, 2008,
changes in exchange rates when compared to the prior year had the effect of increasing operating earnings by
$3.7 million.
37