GameStop 2008 Annual Report Download - page 23
Download and view the complete annual report
Please find page 23 of the 2008 GameStop annual report below. You can navigate through the pages in the report by either clicking on the pages listed below, or by using the keyword search tool below to find specific information within the annual report.-
 1
1 -
2
-
3
-
4
-
5
-
6
-
7
-
8
-
9
-
10
-
11
-
12
-
 13
13 -
 14
14 -
 15
15 -
 16
16 -
 17
17 -
 18
18 -
 19
19 -
 20
20 -
 21
21 -
 22
22 -
 23
23 -
 24
24 -
 25
25 -
 26
26 -
 27
27 -
 28
28 -
 29
29 -
 30
30 -
 31
31 -
 32
32 -
 33
33 -
34
-
35
-
36
-
37
-
38
-
39
-
40
-
41
-
42
-
43
-
44
-
45
-
46
-
47
-
48
-
49
-
50
-
51
-
52
-
53
-
54
-
55
-
56
-
57
-
58
-
59
-
60
-
61
-
62
-
63
-
64
-
65
-
66
-
67
-
68
-
69
-
70
-
71
-
72
-
73
-
74
-
75
-
76
-
77
-
78
-
79
-
80
-
81
-
82
-
83
-
84
-
85
-
86
-
87
-
88
-
89
-
90
-
91
-
92
-
93
-
94
-
95
-
96
-
97
-
98
-
99
-
100
-
101
-
102
-
103
-
104
-
105
-
106
-
107
-
108
-
109
-
110
-
111
-
112
-
113
-
114
 |
 |
generally driven by the introduction of new platform technology and the reduction in price points as platforms
mature. Due to our strong relationships with the manufacturers of these platforms, we often receive dispropor-
tionately large allocations of new release hardware products, which is an important component of our strategy to be
the destination of choice for electronic game players. We believe that selling video game hardware increases store
traffic and promotes customer loyalty, leading to increased sales of video game software and accessories, which
have higher gross margins than video game hardware.
Video Game Software. We purchase new video game software from the leading manufacturers, including
Sony, Nintendo and Microsoft, as well as over 40 third-party game publishers, such as Electronic Arts and
Activision. We are one of the largest customers of video game titles sold by these publishers. We generally carry
over 1,000 SKUs of new video game software at any given time across a variety of genres, including Sports, Action,
Strategy, Adventure/Role Playing and Simulation.
Used Video Game Products. We believe we are the largest retailer of used video games in the world. We
provide our customers with an opportunity to trade in their used video game products in our stores in exchange for
store credits which can be applied towards the purchase of other products, primarily new merchandise. We have the
largest selection (approximately 3,000 SKUs) of used video game titles which have an average price of $18 as
compared to an average price of $41 for new video game titles and which generate significantly higher gross
margins than new video game products. Our trade-in program provides our customers with a unique value
proposition which is generally unavailable at mass merchants, toy stores and consumer electronics retailers. This
program provides us with an inventory of used video game products which we resell to our more value-oriented
customers. In addition, our highly-customized inventory management system allows us to actively manage the
pricing and product availability of our used video game products across our store base and to reallocate our
inventory as necessary. Our trade-in program also allows us to be one of the only suppliers of previous generation
platforms and related video games. We also operate refurbishment centers in the U.S., Canada, Australia and
Europe where defective video game products can be tested, repaired, relabeled, repackaged and redistributed back
to our stores.
PC Entertainment and Other Software. We purchase PC entertainment software from over 45 publishers,
including Electronic Arts, Microsoft and Vivendi Universal. We offer PC entertainment software across a variety of
genres, including Sports, Action, Strategy, Adventure/Role Playing and Simulation.
Accessories and Other Products. Video game accessories consist primarily of controllers, memory cards and
other add-ons. We also carry strategy guides, magazines and trading cards. We carry over 300 SKUs of accessories
and other products. In general, this category has higher margins than new video game and PC entertainment
products.
Store Operations
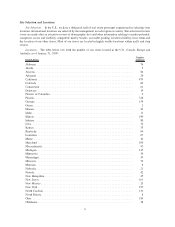
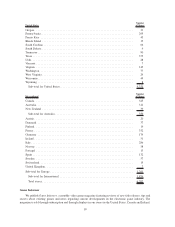
As of January 31, 2009, we operated 6,207 stores, primarily under the GameStop name. Each of our stores
typically carries over 4,500 SKUs. We design our stores to provide an electronic gaming atmosphere with an
engaging and visually captivating layout. Our stores are typically equipped with several video game sampling areas,
which provide our customers the opportunity to play games before purchase, as well as equipment to play video
game clips. We use store configuration, in-store signage and product demonstrations to produce marketing
opportunities both for our vendors and for us.
Our stores average approximately 1,500 square feet and carry a balanced mix of new and used video game
products and PC entertainment software. Our stores are generally located in high-traffic “power strip centers,” local
neighborhood strip centers, high-traffic shopping malls and pedestrian areas, primarily in major metropolitan areas.
These locations provide easy access and high frequency of visits and, in the case of strip centers and high-traffic
pedestrian stores, high visibility. We target strip centers that are conveniently located, have a mass merchant or
supermarket anchor tenant and have a high volume of customers.
8