GameStop 2008 Annual Report Download - page 40
Download and view the complete annual report
Please find page 40 of the 2008 GameStop annual report below. You can navigate through the pages in the report by either clicking on the pages listed below, or by using the keyword search tool below to find specific information within the annual report.-
 1
1 -
2
-
3
-
4
-
5
-
6
-
7
-
8
-
9
-
10
-
11
-
12
-
13
-
14
-
15
-
16
-
17
-
18
-
19
-
20
-
21
-
22
-
23
-
24
-
25
-
26
-
27
-
28
-
29
-
 30
30 -
 31
31 -
 32
32 -
 33
33 -
 34
34 -
 35
35 -
 36
36 -
 37
37 -
 38
38 -
 39
39 -
 40
40 -
 41
41 -
 42
42 -
 43
43 -
 44
44 -
 45
45 -
 46
46 -
 47
47 -
 48
48 -
 49
49 -
 50
50 -
51
-
52
-
53
-
54
-
55
-
56
-
57
-
58
-
59
-
60
-
61
-
62
-
63
-
64
-
65
-
66
-
67
-
68
-
69
-
70
-
71
-
72
-
73
-
74
-
75
-
76
-
77
-
78
-
79
-
80
-
81
-
82
-
83
-
84
-
85
-
86
-
87
-
88
-
89
-
90
-
91
-
92
-
93
-
94
-
95
-
96
-
97
-
98
-
99
-
100
-
101
-
102
-
103
-
104
-
105
-
106
-
107
-
108
-
109
-
110
-
111
-
112
-
113
-
114
 |
 |

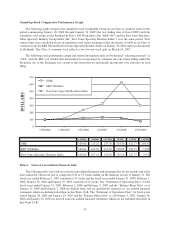
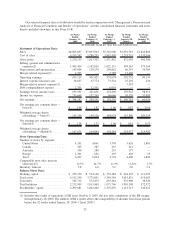
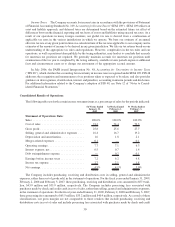
Our selected financial data set forth below should be read in conjunction with “Management’s Discussion and
Analysis of Financial Condition and Results of Operations” and the consolidated financial statements and notes
thereto included elsewhere in this Form 10-K.
52 Weeks
Ended
January 31,
2009
52 Weeks
Ended
February 2,
2008
53 Weeks
Ended
February 3,
2007
52 Weeks
Ended
January 28,
2006(1)
52 Weeks
Ended
January 29,
2005
(In thousands, except per share data and statistical data)
Statement of Operations Data:
Sales ......................... $8,805,897 $7,093,962 $5,318,900 $3,091,783 $1,842,806
Cost of sales .................... 6,535,762 5,280,255 3,847,458 2,219,753 1,333,506
Gross profit .................... 2,270,135 1,813,707 1,471,442 872,030 509,300
Selling, general and administrative
expenses(2) ................... 1,445,419 1,182,016 1,021,113 599,343 373,364
Depreciation and amortization ....... 145,004 130,270 109,862 66,355 36,789
Merger-related expenses(3) ......... 4,593 — 6,788 13,600 —
Operating earnings . . ............. 675,119 501,421 333,679 192,732 99,147
Interest expense (income), net ....... 38,837 47,774 73,324 25,292 236
Merger-related interest expense(3) .... — — — 7,518 —
Debt extinguishment expense ....... 2,331 12,591 6,059 — —
Earnings before income taxes ....... 633,951 441,056 254,296 159,922 98,911
Income tax expense. . ............. 235,669 152,765 96,046 59,138 37,985
Net earnings .................... $ 398,282 $ 288,291 $ 158,250 $ 100,784 $ 60,926
Net earnings per common share —
basic(4)...................... $ 2.44 $ 1.82 $ 1.06 $ 0.87 $ 0.56
Weighted average shares
outstanding — basic(4) .......... 163,190 158,226 149,924 115,840 109,324
Net earnings per common share —
diluted(4) .................... $ 2.38 $ 1.75 $ 1.00 $ 0.81 $ 0.53
Weighted average shares
outstanding — diluted(4) ......... 167,671 164,844 158,284 124,972 115,592
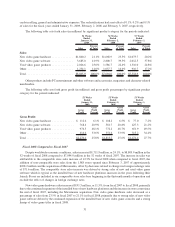
Store Operating Data:
Number of stores by segment
United States.................. 4,331 4,061 3,799 3,624 1,801
Canada ...................... 325 287 267 261 —
Australia ..................... 350 280 219 177 —
Europe ...................... 1,201 636 493 428 25
Total ........................ 6,207 5,264 4,778 4,490 1,826
Comparable store sales increase
(decrease)(5) .................. 12.3% 24.7% 11.9% (1.4)% 1.7%
Inventory turnover . . ............. 5.8 6.0 5.2 5.0 5.4
Balance Sheet Data:
Working capital ................. $ 255,330 $ 534,160 $ 353,284 $ 234,293 $ 111,093
Total assets ..................... 4,512,590 3,775,891 3,349,584 3,015,821 915,983
Total debt ...................... 545,712 574,473 855,484 975,990 36,520
Total liabilities .................. 2,212,909 1,913,445 1,973,706 1,901,108 372,972
Stockholders’ equity . ............. 2,299,681 1,862,446 1,375,878 1,114,713 543,011
(1) Includes the results of operations of EB from October 9, 2005, the day after completion of the EB merger,
through January 28, 2006. The addition of EB’s results affects the comparability of amounts from fiscal periods
before the 52 weeks ended January 28, 2006 (“fiscal 2005”).
25